MRD:kh1015
Triatomic Reactions: Hydrogen Atom and Hydrogen Molecule System
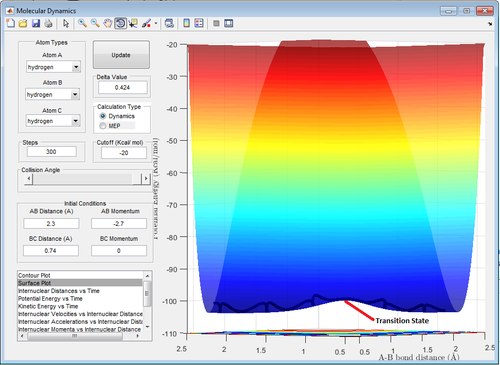
 |
| Figure 1: Triatomic Reactions: H atom and Hydrogen Molecule [1] |
|---|
=2.30
=0.74
=-2.7
=0.0
Gradient at Transition States and Minima
What value does the total gradient of the potential energy surface have at a minimum and at a transition structure? Briefly explain how minima and transition structures can be distinguished using the curvature of the potential energy surface.
Total gradient of the potential energy surface would be zero at a minimum and at a maximum (transition structure).
With reference to the potential energy surface below, any stationary point needs to satisfy by the following equations:
and
, where V is the potential energy of the molecule; is the distance between Hydrogen A and B; and is the separation between Hydrogen B and Hydrogen C.
As observed from the table above, the transition state occurs at the saddle point, which is the intersection between the maximum point of a downward parabola (First Perspective) and the maximum point of an upward parabola (Second Perspective). The second derivative of a maximum point is negative while the second derivative of a minimum point is positive. For the transition point,
and .
For the minimum point,
and .
Trajectories from r1 = r2: locating the transition state
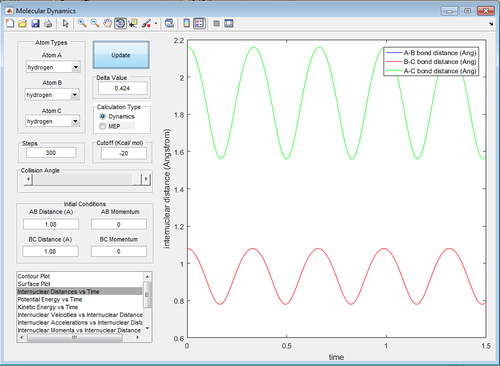
Report your best estimate of the transition state position (rts) and explain your reasoning illustrating it with a “Internuclear Distances vs Time” screenshot for a relevant trajectory.
The transition state position (rts) is at . Noticeably, the bond vibration is absent at the "true" rts (Figure 5) as opposed to those in Figure 4 and 6. This is consistent with literature that bond vibrations are rapidly damped at the transition state.[2] Force is equal to the first derivative of potential energy with respect to time. At the transition state, potential energy is at its maximum in the energy profile and therefore, there is zero force acting on the bonds. Consequently, the bonds are not vibrating and will remain so until there is infinitesimal energy to push it away from its quasi-equilibrium state (Newton's First Law of Motion).
Furthermore, transition H-H bond length () is expected to be longer than the normal H-H bond length () because the extreme hydrogen atoms are "half-connected" to the central hydrogen (Bond order for both is equal and below 1).
Comparison between Minimal Energy Pathway(MEP) and Dynamic Calculations
Comment on how the mep and the trajectory you just calculated differ.
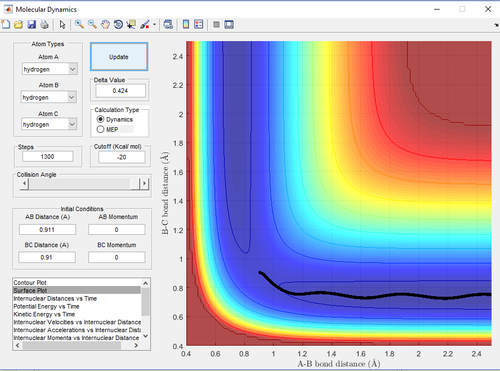
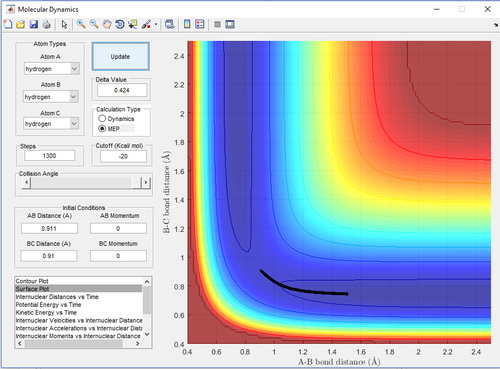
The step of the reaction was set to 1,300 for both cases to observe appreciable results for the MEP calculation. For both cases, = 0.911 and = 0.91 .
and = 0 momentum units. <-- Which are? Je714 (talk) 10:30, 22 May 2017 (BST)
Referring to table 3 below, it can be deduced that each unit step in Dynamic calculation is much larger than that in MEP. Another difference is that in the Dynamic calculation, the reaction path beyond the transition state shows that the molecule has certain amount of vibrational energy whereas in the MEP, the path shows the minimum energy path (straight line), which indicates minimum vibrational energy.
| Table 3: Effect of Calculation Method on Trajectory | |
|---|---|
| Figure 7: Dynamic Trajectory Calculation | Figure 8: MEP Trajectory Calculation |
 |
 |
Reactive and unreactive trajectories
Complete the table by adding a column reporting if the trajectory is reactive or unreactive. For each set of initial conditions, provide a ! style="text-align: centre;"
|-screenshot of the trajectory and a small description for what happens along the trajectory.
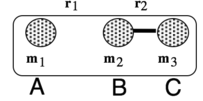
=0.74 and =2.0. In this context, is and is .
The reactant and product should possess the same amount of potential energy in the energy profile diagram (no net thermodynamic gain or loss). Hence, the sole determinant of whether the reaction happens is whether the system is able to overcome the activation energy to reach the transition state. <-- This reflects the pre-conceived notion that a reaction will occur if enough energy is given to the reactants. This is actually what is disproven with the following sets of conditions. You do observe a case of recrossing, in which you end up back with the starting arrangement due to barrier recrossing. Having enough energy to overcome the Energy of activation of the TS is not enough to have a successful reaction. Je714 (talk) 10:36, 22 May 2017 (BST)
| Table 4 | ||
|---|---|---|
| p1 | p2 | Reactive (R) or Unreactive (U) |
| -1.25 | -2.5 | R |
 | ||
| Figure 9: Condition 1. In condition 1, the collision of the H atom into the hydrogen molecule results in a reaction. Beyond the transition state in the forward reaction, the products possess some vibrational energy. | ||
| -1.5 | -2.0 | U |
 | ||
| Figure 10: Condition 2. In condition 2, the collision of the H atom into the hydrogen molecule does not result in a reaction. The momentum of the hydrogen atom was insufficient to take the system to the transition state (insufficient energy to overcome activation energy also known as kinetic barrier). | ||
| -1.5 | -2.5 | R |
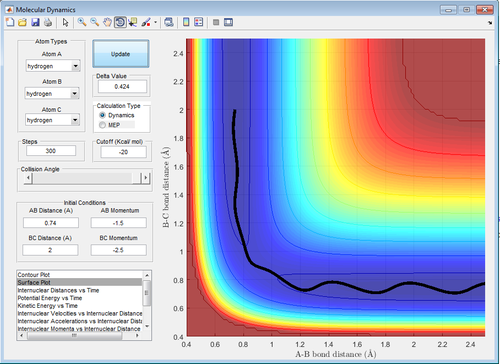 | ||
| Figure 11: Condition 3. In condition 3, the collision of the H atom into the hydrogen molecule results in a reaction. Before and beyond the transition state in the forward reaction, the products possess some vibrational energy. | ||
| -2.5 | -5.0 | R |
 | ||
| Figure 12: Condition 4. In condition 4, the collision of the H atom into the hydrogen molecule results in a reaction. Beyond the transition state in the forward reaction, the products possess so much vibrational energy that they re-cross the transition state one more time to form the reactants. (How can you end up with the reactans and have a Reactive trajectory? This is an Unreactive trajectory, since you end up back where you started. There is barrier recrossing, back to the reactants, and no products are formed. Je714 (talk) 10:33, 22 May 2017 (BST)) | ||
| -2.5 | -5.2 | R |
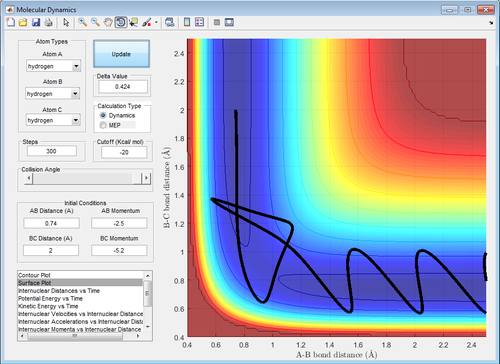 | ||
| Figure 13: Condition 5. In condition 5, the collision of the H atom into the hydrogen molecule results in a reaction. Beyond the transition state in the forward reaction, the molecule possess so much vibrational energy that it double-crosses the transition state before forming the final products. The final products still possess a high vibrational energy as observed. | ||
State what are the main assumptions of Transition State Theory. Given the results you have obtained, how will Transition State Theory predictions for reaction rate values compare with experimental values?
There are three main assumptions in the Transition State Theory (TST):[3]
1) That the rate of a reaction is affected by the position of the transition state with respect to the reactants.
2) The activated complex is in a state of quasi equilibrium. (What is mean by this? Here we are just looking at a triatomic collision in isolation, not at an ensemble of molecules. So not really applicable in this situation. Je714 (talk) 10:42, 22 May 2017 (BST))
3) Only translational contribution is being considered for the collision and that their relationship can be expressed using kinetic theory (Purely Temperature Dependent).
Referring to Figure 10, the computational calculation shows the possibility of the system reverting to formation of the reactants through double crossing of the transition state (Your Figure 10 is not showing double recrossing. It simply hasn't enough energy to reach the TS. Double recrossing happens in Figure 12, condition 4, which you actually labeled as a Reactive trajectory Je714 (talk) 10:42, 22 May 2017 (BST))
due to the vibrational energy of the molecule, which is ignored in TST. This effect would result in overestimation of rate constant. However, predicted rate could also be lower than empirical rate because it fails to take into account non-temperature dependent factors such as electrostatic attractions (How do you know electrostatic interactions are not taken into account in this computational model? Je714 (talk) 10:42, 22 May 2017 (BST))
. Golden's work has shown that the theoretical predictions for the rate of reaction are lower than experimental values even for a non-ionic species.[4]. The deviations are expected to be larger if highly-charged species are involved. This means that in overall perspective, the factors that cause the underestimation of rate constant is more dominant than those causing the overestimation of rate constant.
Furthermore, there is a severe limitation of TST application is in a thermally disallowed but photochemically allowed reactions such as pericyclic reaction of two ethenes to form a cyclobutadiene. The simple rate expression in terms of kinetic theory is insufficient to factor in the nuances of orbital interactions (radiational activation).
Triatomic Reactions: F - H - H system
PES inspection
Classify the F + H2 and H + HF reactions according to their energetics (endothermic or exothermic). How does this relate to the bond strength of the chemical species involved?
The reaction is highly exothermic () because the newly formed H-F is much stronger than H-H bond ( rather than ).[5]
Consequently, the reverse reaction (H + HF reaction) is highly endothermic().
Locate the approximate position of the transition state.
Hammond's Postulate states that the geometry of the transition state is closer to the reactant or product, to whichever is closer in energy.[6]
With reference to the exothermic reaction (), the transition state position of F-H-H is and respectively. In an exothermic reaction, the transition state would be closer in energy to the reactants and therefore, it will resemble the reactants geometry more than the products. Evidently, in the transition state, the H-H bond length is only slight distorted from its equilibrium ( as compared to ), while the forming H-F bond is far from its equilibrium bond length ( as compared to ). This is consistent with Hammond's Postulate.
 |
| Figure 14: Transition State Position of F-H-H species |
|---|
(Good Je714 (talk) 10:45, 22 May 2017 (BST))
Report the activation energy (Ea) for both reactions.
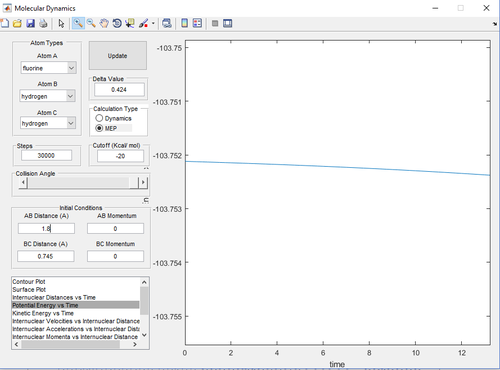
With respect to the forward exothermic reaction (), the Ea is .
With respect to the backward endothermic reaction (), the Ea is .
(Missing a bit of discussion here. How did you get these numbers? Explain it, don't just give a couple of screen shots without a reason. Je714 (talk) 10:45, 22 May 2017 (BST))
| Table 5 | ||
|---|---|---|
 |
 |
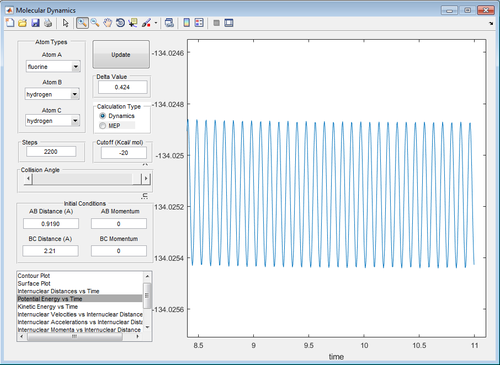 |
| Figure 15: Reactants Energy Level () | Figure 16: Transition State Energy Level () | Figure 17: Products Energy Level () |
Reaction dynamics
In light of the fact that energy is conserved, discuss the mechanism of release of the reaction energy. How could this be confirmed experimentally?
In Statistical Thermodynamics, there are four degrees of freedom to energy: translational, vibrational, rotational and electronic energy. TST model assumes only the translational energy, ie. the energy is released as heat to the surroundings. However, calculation has shown in Figure 18 that some of the energy is stored in the vibrational energy in H-F molecule. Some energy could be stored in the rotational component of the H-F and H atoms. Finally, the H atom ejected could be in an electronically excited state as Polanyi has shown in his sodium iodide plus sodium reaction where the product is an electronically excited sodium atom.[7]
To confirm this by experiment, the excess translational energy can be tracked with bomb calorimetry (measuring rise in temperature of the water). The excess rovibrational energy could be tracked by Raman Spectroscopy. The excess electronic energy could be tracked by a simple emission spectrum using a slit, prism and a photographic film.
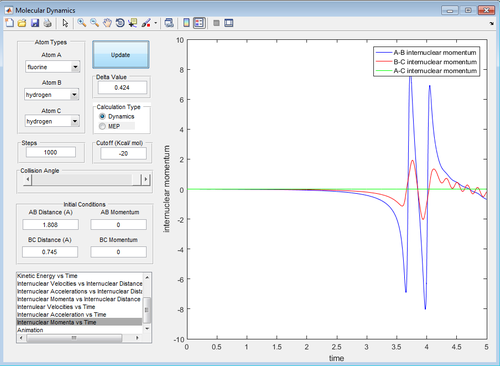 |
| Figure 18: Internuclear Momentum Against Time of H-F and H |
|---|
Discuss how the distribution of energy between different modes (translation and vibration) affect the efficiency of the reaction, and how this is influenced by the position of the transition state. Polanyi's empirical rules predict that for triatomic reactions, vibrational energy is more effective than translational energy in promoting an endothermic reaction, while translational energy is more effective in promoting an exothermic reaction.[8] The main concept is that for a triatomic reactions (A + BC), energy is released as vibrational energy as A approaches B, whereas energy is released as translational energy as C separates from B.[8]
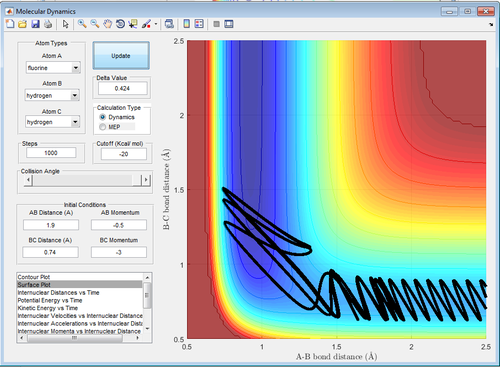
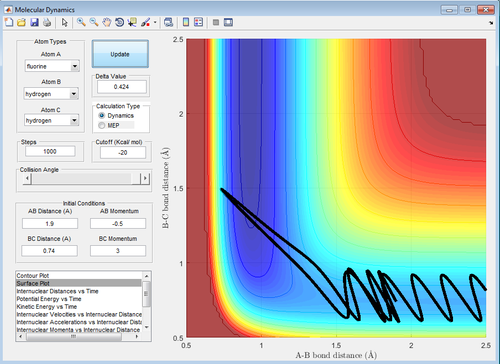
In an endothermic reaction, Hammond's Postulate states that the transition state resembles the product more than the reactants, which means that vibrational energy is more effective than translational energy, vice versa. Referring to table 6, it can be seen that high vibrational energy but low translational energy (-0.5 momentum units) like those in Figure 19 and 21 (-3.0 and 3.0 momentum units) result in a reaction but that reverts to the reactants. In contrast, in Figure 20 and 22, low vibrational energy (-0.5 and 0.5 momentum units) at low translational energy(-0.5 momentum units) results in the formation of products. This is in agreement with the prediction that for an exothermic reaction, translational energy is more effective than vibrational energy in promoting the reaction. In fact, high vibrational energy blocks an exothermic reaction from happening.
| Table 6: Forward Exothermic Reaction | |
|---|---|
 |
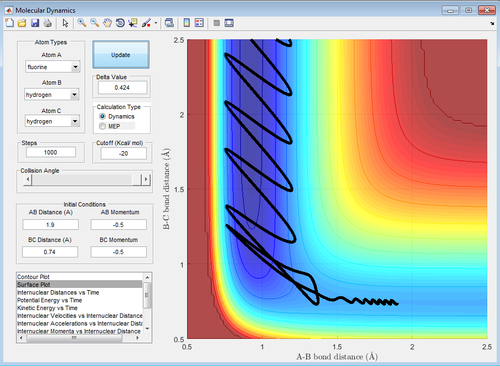 |
| Figure 19: High Vibrational Energy | Figure 20: Low Vibrational Energy |
 |
 |
| Figure 21: High Vibrational Energy | Figure 22: Low Vibrational Energy |
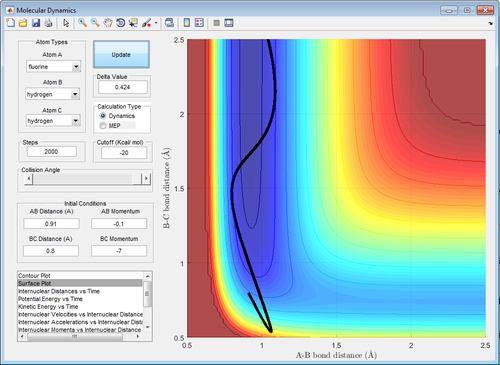
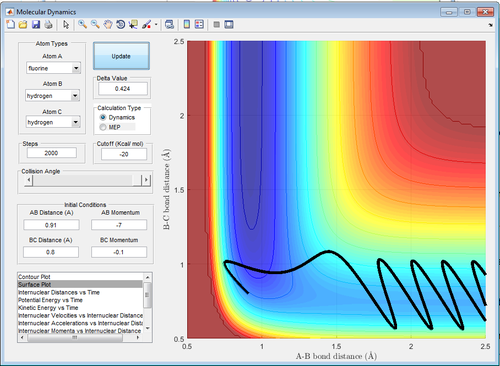
In contrast, for an endothermic reaction, high vibrational energy(-7.0 momentum units) with low translational energy(-0.1 momentum units) favours the formation of the product as shown in Figure 24. The opposite is shown in Figure 23 where there is no reaction (the system does not reach the transition state). This is also in agreement with the prediction.
| Table 7: Backward Endothermic Reaction | |
|---|---|
 |
 |
| Figure 23: High Translational Energy | Figure 24: Low Translational Energy |
References
- ↑ Imperial College London, 16 May 2017. https://wiki.ch.ic.ac.uk/wiki/index.php?title=CP3MD
- ↑ M. Bishop, J. Roscioli, S. Ghosh, J. Mueller, N. Shepherd and W. Beck, The Journal of Physical Chemistry B, 2015, 119, 6905-6915. http://pubs.acs.org/doi/pdf/10.1021/acs.jpcb.5b02391
- ↑ K. LAIDLER and M. KING, Chemischer Informationsdienst, 1983, 14, 2657-2664. http://pubs.acs.org/doi/pdf/10.1021/j100238a002
- ↑ D. Golden, The Journal of Physical Chemistry, 1979, 83, 108-113. http://pubs.acs.org/doi/pdf/10.1021/j100464a018
- ↑ http://www.sartep.com/chem/chartsandtools/bondenergy.cfm
- ↑ https://chem.libretexts.org/Reference/Organic_Chemistry_Glossary/Hammond%E2%80%99s_Postulate
- ↑ J. Polanyi, Journal of Quantitative Spectroscopy and Radiative Transfer, 1963, 3, 471-496. http://ac.els-cdn.com/0022407363900268/1-s2.0-0022407363900268-main.pdf?_tid=469ce4c6-3c92-11e7-92b9-00000aacb35e&acdnat=1495198640_0dee2b3cad23eba7d15b0ec170d8180e
- ↑ 8.0 8.1 J. POLANYI, Science, 1987, 236, 680-690. http://pubs.acs.org/doi/pdf/10.1021/ar50053a001


