
MRD:katsu
H + H2 system
Definition of the system
We have a 3 atom system composed of a H atom (m1) and a H2 molecule (m2-m3). The distance between the m1 and m2 is denoted r1 while the bond distance (or more precisely the distance between m2 and m3) is r2.
If we give m1 kinetic energy, it will collide with an oscillating m2-m3, forming a new vibrationally excited m1-m2 molecule, passing through a transition state and kicking out m3.

Definiton of a transition state on a potential energy surface

The transition state can be defined as the saddle point of the surface, that is where there is a negative slope in one direction and positive in all others. This translates mathematically to the point where:
, , .
Note, the x, y and z are interchangeable, it is truly the fact that one of these is negative while the other two are positive that is important.
The saddle point is different to local minima because they are defined as:
, , .
Locating the transition state
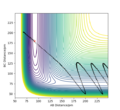
Using conditions of r1 = r2, and p1 = p2 = 0.0 g.mol-1.pm.fs-1, we can test different values of r1 = r2 to estimate the transition state position. We can use a plot of internuclear distances against time to help estimate as once there is no fluctuation of these, we can assume we are at the transition state. Additionally, if there is no forces along r1 and r2, this is assumed to be the transition state.
The estimated transition state position is rTS=90.775 pm.

Ok, It may be best to refer to figures numerically within the text. Good estimate otherwise. Rs6817 (talk) 11:29, 4 June 2020 (BST)
Reaction paths and trajectories
Setting r1=91.775 pm and r2=90.775 pm, we can send the reaction in the direction of the products. If we compare plots using the MEP and dynamics options, we can see that the dynamics plot is more vibrational while the MEP display a more "linear" trajectory. This is because the MEP method resets momentum and velocity at each step and moves infinitely slowly. In opposition to this, the dynamic view allows the atoms to build up momentum, leading to the oscillatory behaviours.

Good answer but some more detail on the implications of the methods would aid your answer here. Rs6817 (talk) 11:29, 4 June 2020 (BST)
Reactive and unreactive trajectories
We can explore the reactivity of trajectories by modifying the initial mometum values in our computation:
| p1/ g.mol-1.pm.fs-1 | p2/ g.mol-1.pm.fs-1 | Etot / kJ.mol-1 | Reactive? | Description of the dynamics | Illustration of the trajectory |
|---|---|---|---|---|---|
| -2.56 | -5.1 | -415.0 | Yes | m1 approaches the H2 molecule, forms the activated complex and reacts to form a vibrationally excited m1-m2 . | 
|
| -3.1 | -4.1 | -420.8 | No | m1 does not have enough kinetic energy to collide with m2-m3, and so does not arrive at the transition state region. This causes the reaction to stay on the side of the reactants | 
|
| -3.1 | -5.1 | -414.7 | Yes | The system is vibrationally excited going into the reaction and when it comes out. | 
|
| -5.1 | -10.1 | -358.0 | Yes | The system passes through the transition state region briefly but quickly reverts to reactants. | 
|
| -5.1 | -10.6 | -350.2 | Yes | The system has enough kinetic energy to overcome the activation barrier, it then passes back over to the reactants and finally reacts a final time to give very vibrationally excited products. | 
|
Your description for the third reaction is very confusing. More detail is required for the last two as well. Barrier recrossing is occuring in both instnaces but you have not made this clear. You could have concluded your oservations in this table with some analysis. Rs6817 (talk) 11:29, 4 June 2020 (BST)
Transition state theory
TST will give a good estimation of reaction rate values as it considers a number of factors such as but due to two assumptions, that quantum effects can be ignored and that products cannot reform into reactants, there will be both a part underestimation and part overestimation of rate. As the size of Ea affects the rate of reaction, if molecules can bypass a part of this barrier via tunneling, there will be more products than expected. However, if these products can cross back to reactants, there will be a decrease in rate. This effect is exemplified for the second-last trajectory above. The rate will most likely be overestimated by TST as quantum tunneling would have an almost negligeable effect on rate.
Good description. Rs6817 (talk) 11:29, 4 June 2020 (BST)
Full calculation of rate using these two methods would allow for a full comparison to determine the size of the effect the assumptions have.
F-H-H system
Potential energy surface inspection

We can inspect the energic nature of two reactions from the same potential energy surface. Labelling F as A, Ha as B and C as Hb, a surface is generated. It is important to ignore the trajectories present on these figures as it is merely the potential energy as function of atomic distance that we are interested in.
:
If we look at decreasing AB distance, we can see a decline in potential while at the same time, increasing BC causes a similar decrease in potential. A decrease in energy allows us to say that this reaction is in fact exothermic. This is corroborated by the fact that H2 bond dissociation energy is 432 kJ.mol-1 while for HF lies at 566.1 kJ.mol-1.[1]
From the PES, we can estimate the position, rTS, of the transition state. We can apply Hammond's postulate here and, as the reaction is exothermic, we can assume the transition state is similar to the products. Thus, we can get an idea of the position by forst setting the BC distance to the H-H bond length (74 pm) and AB to an arbitrary 200 pm to simulate a random position during a reaction. From this, by minimising AB and BC distance variations and forces along these axes, rTS is situated at AB = 181.41 pm and BC = 74.479 pm. The method here is used above (locating transition state for H-H-H system) so no new figure for internuclear distance v.s. time is needed.
Good determination of the TS bond lengths. Rs6817 (talk) 11:29, 4 June 2020 (BST)
Using the transition state postion estimated above, we can subtract the energies of the reactants from the transition state energy (Ea) to determine the activation energy (E0). Ea is the potential enrgy of the system at rTS and we can get Ereactants by setting AB to a very large number to avoid any interaction (e.g. 1000000 pm) and BC to 74.479 pm and using the potential energy of the system at this point.
We then have:
This small activation energy is consistent with the highly reactive behaviour of this mechanism.

Well calculated, you could have included an Energy vs time plot to help illustrate this. Rs6817 (talk) 11:29, 4 June 2020 (BST)
:
As we decrease BC distance, equivalent to an approaching Hb atom, there is an increase in potential energy along with similar behaviour when AB distance is increased. Therefore, this reaction is endothermic. This is coherent with the last result (bond energies for example) and can be seen as a "reciprocal" reaction.
As before, we can also estimate the transition state location for this reaction. As this is an endothermic reaction, according to Hammond's postulate, the transition state will be "product-like". We set BC to the H-H bond length and AB to an arbitary 200 pm. Using the method outlined earlier, rTS lies at AB = 181.41 pm and BC = 74.479 pm. The transition state lies at the same spot for both reactions as they are the "same" reactions but in reverse. To go one way along the reaction coordinate or the other, you will still pass through the same TS.
We can calculate the activation energy for this reaction in the same way outlined for the reverse reaction. Setting the AB distance to the H-F bond length (92 pm)[2] and BC to a very large value allows for extraction of Ereactants:
Good. Rs6817 (talk) 11:29, 4 June 2020 (BST)
Reaction dynamics

Energy from this reaction is being released via vibrational excitation, seen by the oscillating AB distance coming out of the reaction. We could confirm this energy release experimentally via IR spectroscopy. If we compare an IR absorption spectrum of HF vs a spectrum of the HF produced in this reaction, we would observe an additional overtone peak at a lower wavenumber. The intensity of this would be proportional to the amount of vibrationally excited HF molecules. Going further, if we observe this IR behaviour over the reaction, the ovetone would quckly appear and grow while the fundamental band would decrease in intensity. There would then be decrease in overtone size as the excited states emit radiation when they return to ground state until the overtone had disspeared and the fundamental band would be the same as in a "stock" HF spectrum. We could thus measure the amount of energy released by the reaction from absorption IR spectroscopy.
In complement to this, we could use infrared chemiluminescence (IRCL) to study the IR emission spectrum of this reaction. The HF product would exhibit peaks corresponding to hot bands arising from vibrational excitation. HF in a non-excited state, for example, long after the reaction has occured, would not show these emission bands as most, if not all, molecules would be in the ground state. The intensity of these peaks are proportional to the population to that vibrational level. IRCL would give us a good image of just "how excited" our product was.
What about a technique like Bomb calorimetry? Otherwise well done.Rs6817 (talk) 11:29, 4 June 2020 (BST)
John Polanyi proposed that the major degree of freedom of a molecule coming into a reaction will favour either an endo- or exothermic reaction.[3] Now this doesn not suggest selectivity between types of reaction , it means that if criteria are met, a reaction will proceed faster. We can explore these rules through this computation. If we place high amounts of vibrational energy into the H-H bond for F+H2 → HF + H, we see that the reaction will rarely proceed, with F colliding with a very vibrationally excited H2, bonding for a moment and H2 reforming, still excited. Polanyi's rules say that for a reaction such as this (exothermic, early transition state), translation energy is prefered over vibrational. This is exemplified by the fact that the high vibrational energy of H2 causes the reaction to fail. We can rationalise this as vibrational energy causing the reactants to "hit the wall" next to the transition state and fall back down to the bottom of the well.
If we observe the opposite reaction, vibrational excitation actually allows the reaction to proceed better. The vibrational energy allows the surmounting of the barrier. If translational energy were predominant, the system couldn't skirt over the TS, meaning the reaction wouldn't happen.
-
 Vibrational doesn't allow the exothermic reaction to take place.
 -
 The reaction passes over the TS thanks to vibrational energy in the endothermic reaction


Ok, you could have included a few more trajctories to explore the dependence on vibrational / translational dependence on exo / endo thermicity. Rs6817 (talk) 11:29, 4 June 2020 (BST)
References
- ↑ [https://cccbdb.nist.gov/exp2x.asp?casno=7664393&charge=0. National Institute of Standards and Technology, Experimental data for HF (Hydrogen fluoride), ]
- ↑ [https://nvlpubs.nist.gov/nistpubs/Legacy/NSRDS/nbsnsrds31.pdf National Bureau of Standards, in Bond Dissociation Energies In Simple Molecules, UNITED STATES DEPARTMENT OF COMMERCE, 1970, p. 28.]
- ↑ [https://science.sciencemag.org/content/sci/236/4802/680.full.pdf J. C. Polanyi, Science, 1987, 236, 680–690.]