MRD:jz14318
EXERCISE 1: H + H2 system
Dynamics from the transition state region
Identification of transition state
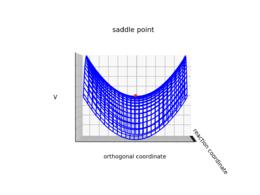
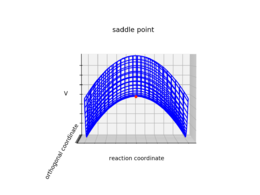
Transition state can be mathematically defined as the saddle point or the minimax point of the potential energy surface.1 The gradient of the potential is zero at the saddle point. As shown in the figure below, a saddle point has a positive second derivative (e.g. minimum) in one direction, and a negative second derivative (i.e. maximum) in the other direction. By contrast, the second derivative for a local minimum is positive in both directions.
| A representation of a saddle point on a graph | Upward curvature along the orthogonal coordinate | Downward curvature along the reaction coordinate |
|---|---|---|
 |
 |
|
Good but its the second partial derivative and the images should be labelled for the local min and max or linked to the description more. Also, your references are not linked properly, there was information on how to do this on your lab script Sf3014 (talk) 22:56, 20 May 2020 (BST)
Trajectories from r1 = r2: locating the transition state
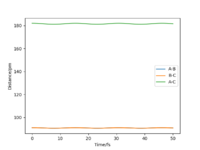
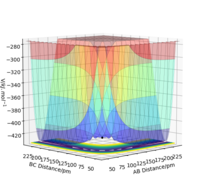
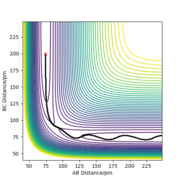
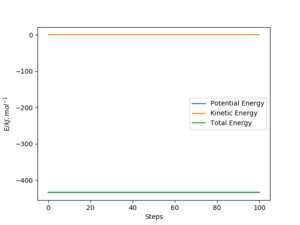
It is suggested that the transition state location rts = 90.5 pm. As the force acting on the atoms depends on the gradient of the potential energy surface, the system at the transition state will have no atoms oscillating as the gradient of the potential energy surface is zero. From the plot above, it can be seen that the atoms oscillate to a very small extent, which indicates that this system is very close to the transition state. Yes but you could be more accurate with your distance and your images are too small so it's hard to see where you got your distance Sf3014 (talk) 23:11, 20 May 2020 (BST)
Trajectories from r1 = rts+δ, r2 = rts

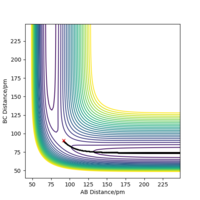
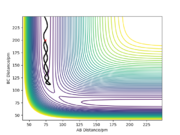
It can be observed from the two plots that mep (see RHS) follows the valley floor to HA + HB - HC, whereas the trajectory by dynamics calculation (see LHS) is wavy (i.e. the atoms are vibrating). This is because by MEP calculation, the atoms do not vibrate as their momenta/velocities are always set to zero in each time step, whereas by dynamics calculation, the total energy is conserved and the atoms do vibrate. Good description. labeling your figures (e.g. fig. 1 etc) makes it easier to refer to them in your text. hOwever, you should show evidence of the momenta being set to zero Sf3014 (talk) 23:15, 20 May 2020 (BST)
Reactive and unreactive trajectories
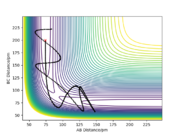
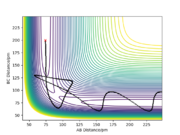
It can be concluded from the table that not all trajectories having sufficient energy to react will be reactive due to the possibility of barrier recrossing. Very good description and conclusion Sf3014 (talk) 23:22, 20 May 2020 (BST)
Transition State Theory
Transition state theory assumes that all trajectories with a kinetic energy along the reaction coordinate larger than Ea will be reactive.2 However, compared with the previous experimental results, this assumption seems fallacious. Some reactions will be unreactive even though the trajectory has a sufficient kinetic energy due to the recrossing of barrier. The second factor is that Transition State Theory ignores the effect of quantum tunneling and treats the motion of atoms classically. Given this, the reaction rate values predicted by Transition State Theory will possibly be larger than experimental values and Transition State Theory slightly overestimates the reaction rate of reactions. Yes but you gave two different points that may have different affects on the reaction rates compared to the experimental values Sf3014 (talk) 23:22, 20 May 2020 (BST)
EXERCISE 2: F - H - H system
PES inspection
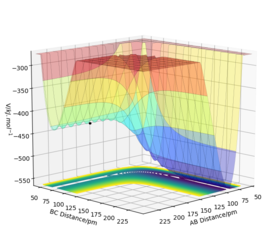
The H + HF reaction is endothermic, for the PES plot shows that the potential energy level of the reactants (AB + C) lies below the potential energy level of the products (BC + A). It can also be rationalised by the fact that the H-F bond being broken in the reaction is stronger than the H-H bond being formed, so it requires an amount of energy to initiate the reaction.
On the other hand, the reverse F + H2 reaction is exothermic, for the PES plot (see RHS) shows that the potential energy of the products (AB + C) is lower than the potential energy of the reactants (BC + A), so energy is released during the reaction. From the perspective of bond strength, a relatively weak H-H bond breaks whilst a strong H-F bond forms.
Good but it is not clear what atom is A, B or C because your clear when referring to your images Sf3014 (talk) 23:33, 20 May 2020 (BST)
In order to locate the transition state of this reaction, according to Hammond's postulate, an endothermic reaction has a late transition state (i.e. the transition state resembles the products) and an exothermic reaction has an early transition state (i.e. the transition state resembles the reactants).3 Therefore, the transition state is closer to F + H2 side (i.e. AB distance is larger than BC distance). Unlike the previous H-H-H system, the F-H-H system is no longer symmetric and thus r1 is not equal to r2 at the transition state.
Well done. It would of been good to see your explanation on the H-H-H system back when you were explaining how you found the TS for that Sf3014 (talk) 23:33, 20 May 2020 (BST)
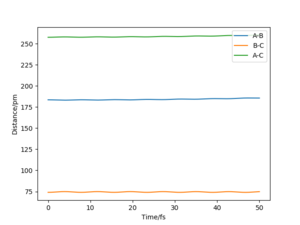
The approximate transition state was found to be r1 = 183.5 pm and r2 = 74 pm, which can be confirmed from the internuclear distance vs time plot below. The atoms are only slightly oscillating, which indicates that there is little force (close to zero) acting on the atoms and the gradient of potential is close to zero (i.e. the system now resembles transition state).
Good, need to be more clear, what is r1 and r2? Sf3014 (talk) 23:33, 20 May 2020 (BST)
Finding activation energies
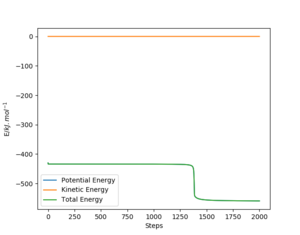
In order to find the activation energy for both reactions, a "mep" was produced from a structure close to the transition state and an energy vs time plot was obtained with 2000 steps.
The energy vs time plot (r1 = 180 pm, r2 = 70 pm) for the F + H2 reaction shows that the difference between the transition state and the products (H + HF) is approximately +123.95 kJ.mol-1, so the activation energy for the H + HF reaction is +123.95 kJ.mol-1.
The energy vs time plot (r1 = 184 pm, r2 = 75 pm) for the H + HF reaction shows that there is little difference between the transition state and the products (F + H2). The activation energy for the F + H2 was found approximately 0.73 kJ.mol-1.
Good. You could zoom in on the energy graphs so it is clear how you calculated your answers Sf3014 (talk) 23:38, 20 May 2020 (BST)
Reaction dynamics

A reactive trajectory for the F + H2 reaction was found when r1 = 180 pm, r2 = 70 pm, p1 = p2 = -1 g.mol-1.pm.fs-1. As this reaction is exothermic, an amount of energy is released by converting potential energy to kinetic energy. It is observed from the animation of this reactive trajectory that after the product HF is formed, F-H bond is vibrating strongly and the other H atom is moving away from HF, so energy is released as translational and vibrational forms. It can also be seen from the momenta vs time plot (see LHS) that the momentum of F-H is fluctuating fiercely, which also indicates that the formed F-H bond is strongly vibrating. Therefore, the reaction energy is released mainly by the vibrational energy of the product. IR spectroscopy can be used to experimentally measure the vibrations. Very good description. Yes IR measures bond frequencies but how can IR be used? Sf3014 (talk) 23:46, 20 May 2020 (BST)
As stated in Hammond's postulate, an exothermic reaction has an early transition state.3 The translational energy of the reactant is more effective than its vibrational energy in order too cross the barrier for an early transition state reaction, so the subsequent product will be vibrationally "hot" rather than translationally "hot".4,5 Conversely, for an endothermic (late TS) reaction, the energy of the reactant will distribute more to vibration than to translation, resulting in a product possessing a larger amount of translational energy than vibrational energy.
This needs more explanation you could run simulations and show how the reactions depend either the translational or the vibrational energies based on the direction of the H-F-H reaction system Sf3014 (talk) 23:46, 20 May 2020 (BST)
References
1. H. Anton, I. Bivens and S. Davis. Calculus, Multivariable Version, 2002. p. 844.
2. J. I. Steinfeld, J. S. Francisco and W. L. Hase. Chemical Kinetic and Dynamics, 2nd ed., Prentice-Hall, 1998.
3. G.S. Hammond. A Correlation of Reaction Rates. J. Am. Chem. Soc. 1955, 77 (2): 334–338. doi:10.1021/ja01607a027.
4. J.C. Polanyi. Some Concepts in Reaction Dynamics. Science 1987, 236 (4802): 680-690. doi:10.1126/science.236.4802.680
5. S. Yan, Y. Wu and K. Liu. Tracking the energy flow along the reaction path. PNAS 2008 105(35): 12667-12672.

