MRD:jz12018
Molecular Reaction Dynamics
Exercise 1ː H + H2 System
Q1ː On a potential energy surface diagram, how is the transition state mathematically defined? How can the transition state be identified, and how can it be distinguished from a local minimum of the potential energy surface?
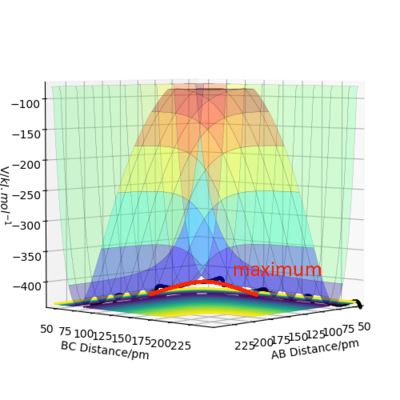
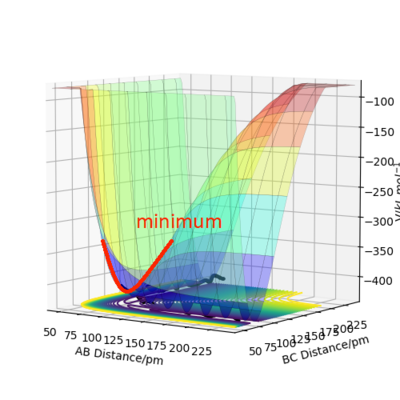
A transition state is a saddle point on the surface plot. It can be identified as the maximum on the minimum energy path linking the reactants and products. The local minima of the potential energy surface are minima viewing from all the angles. Unlike these local minima, the transition state is a minimum point viewing from one perspective but a maximum viewing from an orthogonal perspective.The two perspectives are shown in the diagrams below.
Nice answer! Mak214 (talk) 18:18, 13 May 2020 (BST)
Q2ːReport your best estimate of the transition state position (rts) and explain your reasoning illustrating it with a “Internuclear Distances vs Time” plot for a relevant trajectory.
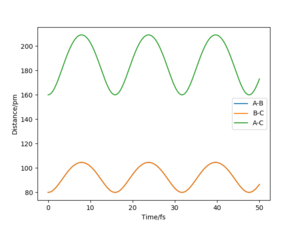
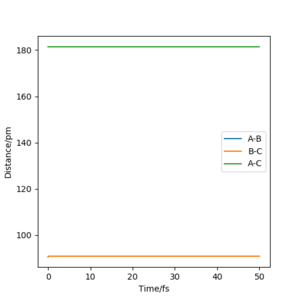
My best estimate of rts is 90.774 pm. The internuclear distances against time graphs only show B-C and A-C curves as A-B overlap with the B-C curve in this symmetric r1=r2 system. The system oscillates around the transition state if it starts somewhere close to the transition state point with 0 momentum (p1=p2=0). In this situation, the internuclear distances against time graph should show oscillations over time, just like the graph below.
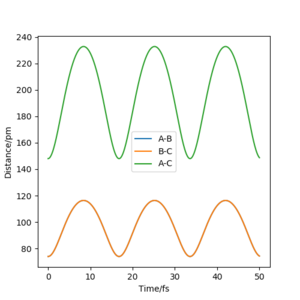
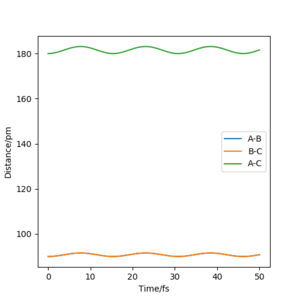
The system will remain stationary at the transition state as it is a minimum point along the initial trajectory. Therefore, the amplitudes of oscillations gradually decrease as the initial r1 and r2 approach rts, as shown in the graphs below. The oscillations gradually die out and the graph becomes a straight line at r1=r2=rts.
This estimate for rts was obtained using the initial geometry information given in the GUI. If the system starts at transition state, the initial forces should be 0 as force is negative derivative of potential energy.
Great. Well done. Mak214 (talk) 18:25, 13 May 2020 (BST)
Q3ːComment on how the mep and the trajectory you just calculated differ.
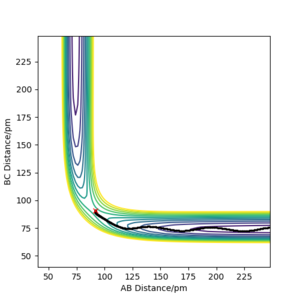
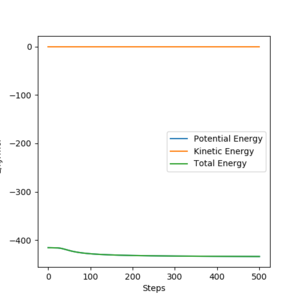
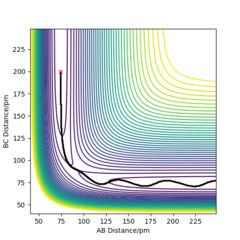
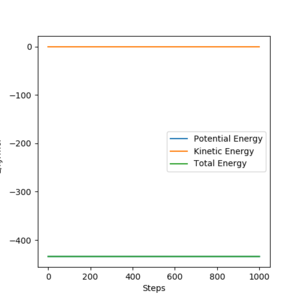
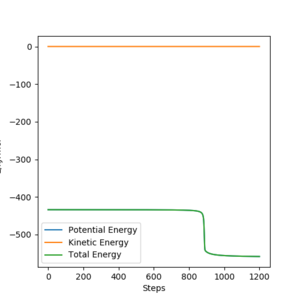
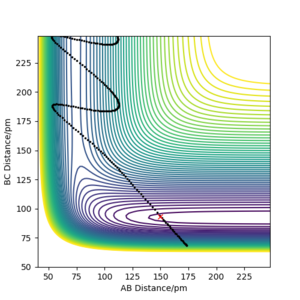
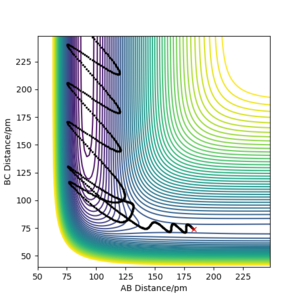
From the contour plots below (r1= 91.774 pm, r2 = 90.774 pm, zero momenta), it is clear that the trajectory generated by mep is much shorter and has no oscillations compared to that generated by dynamics. This is because mep corresponds to infinitely slow motion with zero velocity, momentum and kinetic energy. As there is no kinetic energy, the molecules do not gain vibrational energy from the motion, resulting in zero oscillation of mep trajectory. Another outcome is that total energy = potential energy in mep. As there is no gain in kinetic energy while the system trajectory goes down in potential energy (KE is constantly being lost), the total energy also decreases in the energy against time graph.
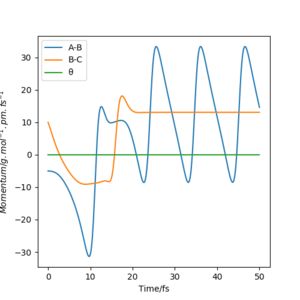
In contrast, the trajectory calculated by dynamics shows periodic oscillations in both the contour plot and the momentum plot. This is because an H2 molecule has been formed and it gained vibrational energy from the reaction. The total energy is conserved in dynamics, hence gain in kinetic energy = loss in potential energy.
Good explanation. You show good understanding here. Mak214 (talk) 18:25, 13 May 2020 (BST)
Q4ːComplete the table above by adding the total energy, whether the trajectory is reactive or unreactive, and provide a plot of the trajectory and a small description for what happens along the trajectory. What can you conclude from the table?
Would be good to make a general comment here on your results - what do they show you about the energy that you put into the system and the likelihood of a reactive interaction overall? Mak214 (talk) 18:25, 13 May 2020 (BST)
Energy greater than or activation energy can lead to a reaction, but too much energy after the initial reaction will result in the products reacting in the reversed direction. If the system has energy less than activation energy than the chance of reactive interaction is 0. Jz12018 17:46, 22 May 2020 (BST)
Q5ːGiven the results you have obtained, how will Transition State Theory predictions for reaction rate values compare with experimental values?
One of the main assumptions of transition state theory is that all trajectories with a kinetic energy along the reaction coordinate greater than the activation energy will be reactive. But given the final two cases in the table above, it was not true in the simulation. The products could recross the barrier to reform reactants. Therefore, transition state theory overestimates the reaction rate values compared to experimental as the products recross the barrier to form reactants in reality, although this recrossing is associated with a low probability.
Another assumption of TST is that it treats motion classically and ignores any quantum effects such as tunnelling. This will leads to a slight underestimation as some collisions with energy less than activation energy can tunnel through the barrier. But overall, transition state recrossing is a more significant effect compared to tunnelling, leading to overestimation of reaction rate by TST.
Nice answer. Mak214 (talk) 18:25, 13 May 2020 (BST)
Exercise 2ː F - H - H System
Q6ː By inspecting the potential energy surfaces, classify the F + H2 and H + HF reactions according to their energetics (endothermic or exothermic). How does this relate to the bond strength of the chemical species involved?
F + H2 is an exothermic reaction from the shape of the minimum energy path shown. H + HF reaction is therefore an endothermic reaction. This implies H-F bond is stronger than H-H bond as formation of H-F bond releases more energy than the breaking of H-H bond in the exothermic F + H2 reaction. Good. Would be nice to find some references and quote the experimental enthalpy values for these reactions. Mak214 (talk) 18:39, 13 May 2020 (BST)
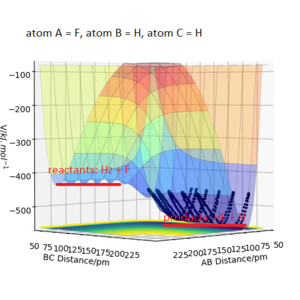
Q7ː Locate the approximate position of the transition state.
The approximate position of transition state for my F-H-H system is r1 = 181.300 pm and r2 = 74.483 pm, with atom A = F and atom B = atom C = H. Potential energy at transition state was -433.981 kJ.mol-1. Good. Mak214 (talk) 18:39, 13 May 2020 (BST)
Q8ː Report the activation energy for both reactions.
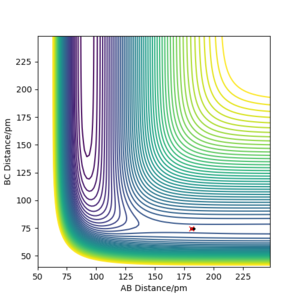
The activation energy for the exothermic F + H2 reaction was 0.233 kJ.mol-1. It was calculated using the potential energy of reactants (F and H2), -434.215 kJ.mol-1 and the potential energy at transition state, -433.981 kJ.mol-1. The potential energy of reactants was calculated by displacing the initial position slightly towards the reactant side. From plotting the energy against time graph using these conditions, the total energy gradually stabilised at the reactant energy level.
The activation energy for the reverse, endothermic H + HF reaction was 122.098 kJ.mol-1. From the energy against time graph, the final potential energy (potential energy of the products in H + HF reaction) was -556.079 kJ.mol-1. The potential energy of products was calculated by displacing the initial position slightly towards the product side, so the final potential energy reading of the system will be the product energy. Good response. Mak214 (talk) 18:39, 13 May 2020 (BST)
Q9ːIn light of the fact that energy is conserved, discuss the mechanism of release of the reaction energy. Explain how this could be confirmed experimentally.
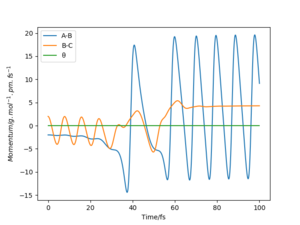
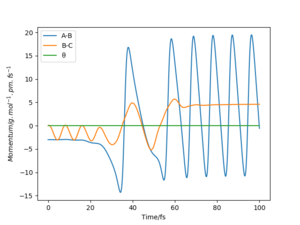
From the graphs of momenta against time for various reactive trajectories, it can be concluded that the system had greater oscillations and moved faster after the reaction. This shows that energy was released in the form of translational kinetic energy and vibrational kinetic energy. This could be confirmed experimentally by measuring the heat released from the reaction - bomb calorimetry. However, bomb calorimetry does not distinguish the difference between gain in translational and vibrational kinetic energy as both energy were measured in the form of heat.
As a better alternative, Coherent IR emission spectroscopy could be used to measure the photons released from vibrational de-excitation after the reaction. The HF molecules formed have great amount of oscillation energy as they were excited to higher vibrational state. IR absorption spectra can also be used to analyse this change in vibrational motion, as the oscillating HF molecules formed by the reaction will generate overtones in the spectra. Nice answer. Thank you. Mak214 (talk) 18:39, 13 May 2020 (BST)
Momenta Against Time Plots (Atom A = F)
Q10ːDiscuss how the distribution of energy between different modes (translation and vibration) affect the efficiency of the reaction, and how this is influenced by the position of the transition state.
Polanyi's rule states that translational energy is then more effective than vibrational energy in overcoming an early transition state barrier; vibrational energy is more effective than translational energy in overcoming a late transition state barrier. In our F-H-H system, reaction starting from F + H2 is an exothermic reaction with an early transition state; reaction starting from H + HF is an endothermic reaction with a late transition state. To illustrate how Polanyi's rule can apply in these two reactions, the following reaction trajectories have been investigated and shown in the images below.
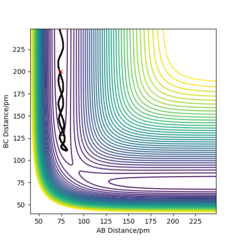
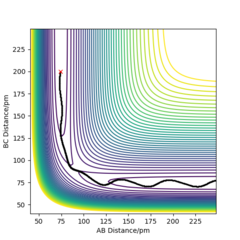
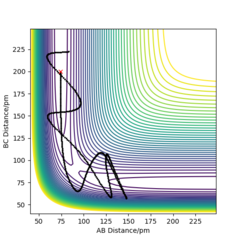
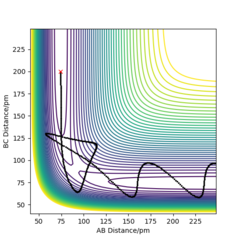
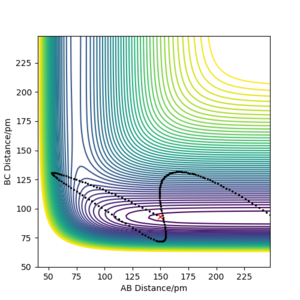
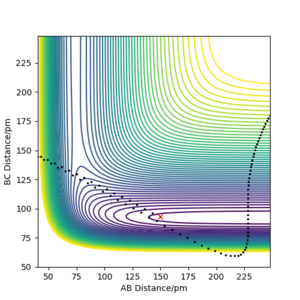
For the H + HF reaction, all the trajectories were plotted with r1 = 150.000 pm, r2 = 93.000 pm and atom C = F. It was verified that vibrational energy is more effective in overcoming the late transition state barrier in this reaction. As shown, p1 (pab) is the translational momentum of H moving towards HF, while p2 (pbc) is the vibrational momentum within the HF molecule. For the roughly the same amount of initial kinetic energy (276-277 kJ.mol, see captions of the plots below) in the system, the reactants with a larger p2 (vibrational momentum within HF) reacted (Figure 1), while the reaction did not occur for the system with a larger p1 (translational momentum of H towards HF) (Figure 2). Even with a much higher kinetic energy, 1228.505 kJ.mol-1, for a system with most energy in translational mode, the reaction still did not occur. Although the H-F bond was broken, H atoms ended up too far away from each other to form H2 (Figure 3).
Contour Plots for H + HF Reaction (Atom C = F, r1 = 150.000 pm, r2 = 93.000 pm)
For the F + H2 reaction, both the trajectories were plotted with r1 = 183.000 pm, r2 = 74.500 pm and atom A = F. It was verified that translational energy is more effective in overcoming the late transition state barrier in this reaction. As shown, p1 (pab) is the translational momentum of F moving towards H2, while p2 (pbc) is the vibrational momentum within the H2 molecule. With a larger proportion of p1 (translational momentum of F moving towards H2), the reaction completed with low initial kinetic energy of 4.118 kJ.mol-1 (Figure 5), while no reaction happened when most energy was distributed in the vibrational mode (larger p2) even at higher initial kinetic energy, KE = 43.836 kJ.mol-1 (Figure 4).
Contour Plots for F + H2 Reaction (Atom A = F, r1 = 183.000 pm, r2 = 74.000 pm)
Great. Would be good to include some references here, for the theory and also to compare your results with experimental values. A solid report. Thank you, and well done. Mak214 (talk) 18:39, 13 May 2020 (BST)

