MRD:jx3515
-Exercise 1
Dynamics from the transition state region
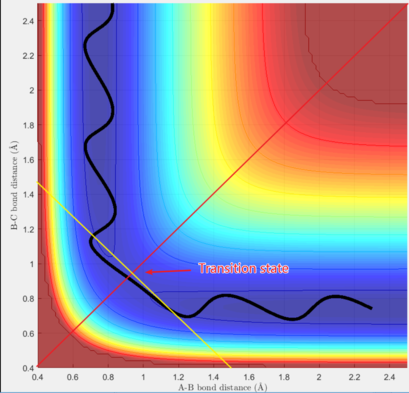
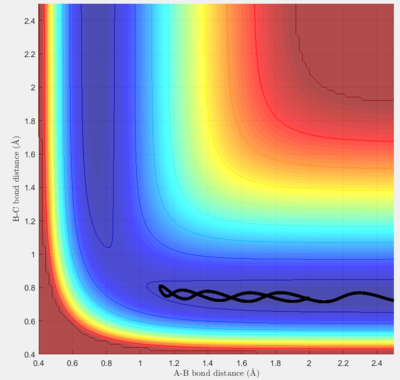
For the given initial conditions, the graph shows that the particle move in the potential well with oscillations. The junction of the two potential wells represents the state that three particles are close to each other, which is transition state of the reaction according to transition state theory. It is found that the potential energy of the transition state is higher than the minimum of each potential well, which is consistent with the assumption of the theory. The smooth curve from one potential well to another shows that the reaction is successful.
What value does the total gradient of the potential energy surface have at a minimum and at a transition structure? Briefly explain how minima and transition structures can be distinguished using the curvature of the potential energy surface.
The gradient of the potential surface at a minimum for either or is zero, i.e. ∂V(r1)/∂r1=0 or ∂V(r2)/∂r2=0
A minimum is a "valley", where the sign of the gradient changes from negative to positive if going from one side to the other side, with respect to one variable, but not necessary for another one:
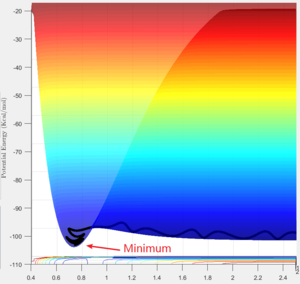
∂V(r1)/∂r1=0, and ∂2V(r1)/∂r12>0
At a transition structure, the gradient with respect to both variables becomes zero, i.e. ∂V(r1)/∂r1=∂V(r2)/∂r2=0, also ∂2V(r1)/∂r12=∂2V(r2)/∂r22=0, which is called a saddle point. As the figure on the right shows, a saddle point is a local maximum with respect to one direction (along the yellow line), but also a local minimum if observed from another direction (along the red line). In other words, the gradient at the saddle point is always zero, no matter looking from which direction. It can be a local maximum (yellow line), a local minimum (red line), or a inflexion point (from the direction of the two potential wells).
Report your best estimate of the transition state position (rts) and explain your reasoning illustrating it with a “Internuclear Distances vs Time” screenshot for a relevant trajectory.
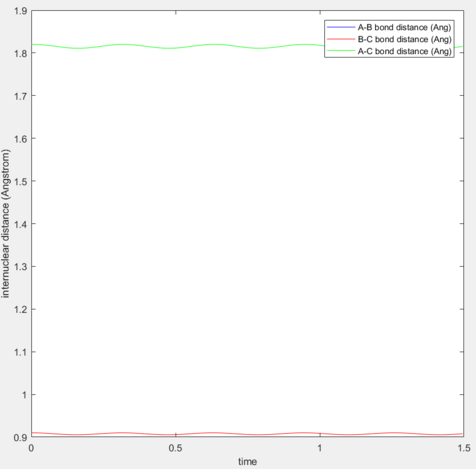
After several trials, it is found that at p1=p2=0.91 Å, the trajectory becomes the smallest, at which the graph of “Internuclear Distances vs Time” shows like above.
If the system is arranged right at the transition state, the trajectory will oscillate on the unstable equilibrium and never fall off unless any perturbation is applied. From the graph above it can be seen that there is a very small oscillation between adjacent particles, while their general relative distance remains unchanged.
Comment on how the mep and the trajectory you just calculated differ.
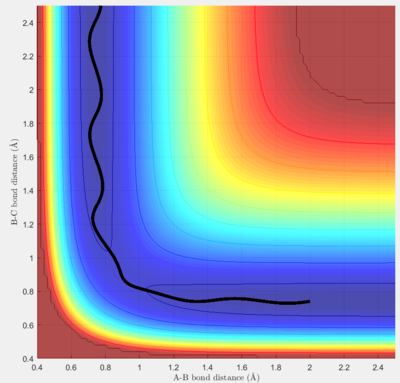
To investigate the reaction path of the model, two different algorithms were applied under initial conditions r1 =0.92 Å and r2=0.91 Å.
| MEP Path | Dynamic Path |
|---|---|
 |
 |
The mep is a smoother curve, which is obtained by solely following the gradient at the point and ignoring the velocity (kinetic energy = 0) of the particle. In dynamic mode, the velocity of the particle is also counted into calculation, and the gradient at the position only indicates the force it feels but not velocity, so that the particle no longer takes the mep path, and on the surface plot it takes a longer wavy path instead of the shortest mep path, which is the result of effect of inertia.
Reactive and unreactive trajectories
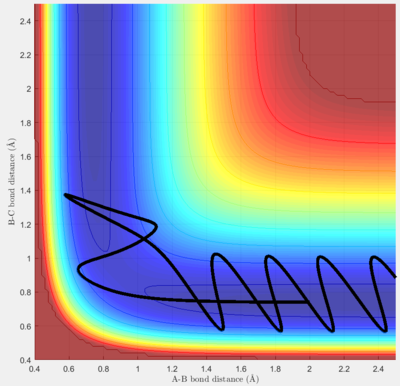
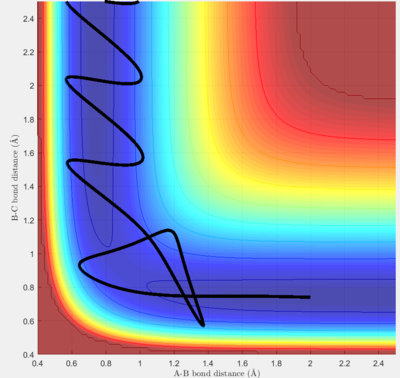
Complete the table by adding a column reporting if the trajectory is reactive or unreactive. For each set of initial conditions, provide a screenshot of the trajectory and a small description for what happens along the trajectory.
For this model, p1 mainly contributes to the vibration energy of the H-H molecule, and p2 contributes to the kinetic energy of the H atom.
State what are the main assumptions of Transition State Theory. Given the results you have obtained, how will Transition State Theory predictions for reaction rate values compare with experimental values?
Transition state theory assumes that there is an intermediate step in the middle of a reaction, where reactants primarily combines to form a "transition state complex" which is in equilibrium with reactants (quasi-equilibrium). [1]The rate of formation of the complex is simply dependent on the amount of reactants and products, as well as the temperatures:
it predicts if temperature increases, the energy of particles increases as well, and the number of particles which can overcome the barrier becomes greater so that the rate will be faster. However, according to the simulation above, it is found that the success of a reaction also dependent on the interaction between vibrational mode and kinetic energy, and increasing energy of the system does not necessarily increase the rate of successful reaction due to the existance of "barrier recrossing". Therefore, it can be expected that the theoretical prediction on the rate of the reaction might be higher than experimental values, for many unpredictable collisions due to high energy lead to unsuccessful reactions.
Exercise 2
Classify the F + H2 and H + HF reactions according to their energetics (endothermic or exothermic). How does this relate to the bond strength of the chemical species involved?
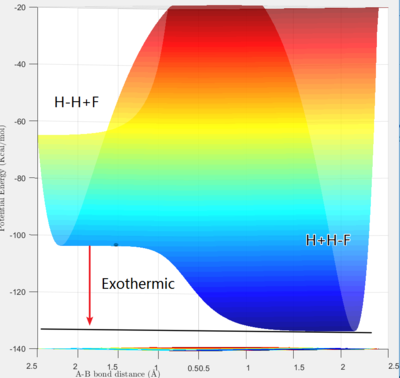
The reaction F + H2 → H + HF is exothermic, and contrarily, H + HF → F + H2 is endothermic, which can be known from inspecting the depth of the two potential wells. Fluorine atoms have the highest electronegativity, which makes them have a great tendency to combine with a hydrogen atom and form a highly polarised bond that is much stronger than a non-polar covalent bond. The exothermic nature of the reaction also indicates that the formation of H-F bond release much more energy than the breakage of H-H bond absorbs, which shows that H-F bonds have a higher strength than H-H bonds.
Locate the approximate position of the transition state.
The transition state of the reaction is approximately at p1=0.75 Å and p2=1.81 Å.
The activation energy of the reaction F + H2 → H + HF is approx. 0.7 kcal/mol. Its reverse reaction has an activation energy of approx. 30.7 kcal/mol.
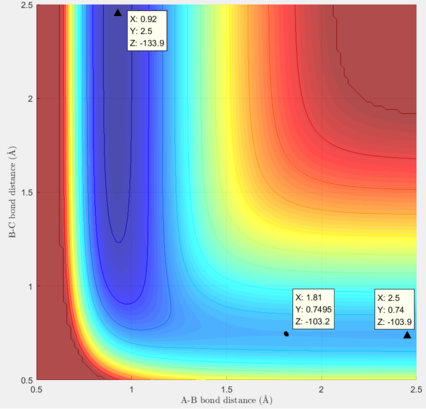
The following experiments are set with initial conditions rHH=0.74 Å and rFH=2 Å. When pFH is set at -0.5, it was found that within the range of -1 < pHH < 0.5, the rate of successful reaction is much higher than -3 < pHH < -1 and 0.5 < pHH < 3. It can be concluded that a high reaction rate may have to satisfy two conditions: a) the translational energy of the atom must be enough to overcome the transition state barrier, which is mainly dependent on pFH, and b) the vibrational energy of the diatomic molecule must lie in an appropriate range, which cannot be too high. If the vibrational energy is out of the range, the molecule will frequently hit the potential wall harshly, making the collision more unpredictable and causing a higher chance for the system to flee from the transition state due to excess energy.
In light of the fact that energy is conserved, discuss the mechanism of release of the reaction energy. How could this be confirmed experimentally?
Primarily, the momentum inputs determine the total energy of the system. Regardless of the transition between potential energy and kinetic energy, translational energy and vibrational energy are interconvertible, by inspecting the graph for internuclear momenta vs time:
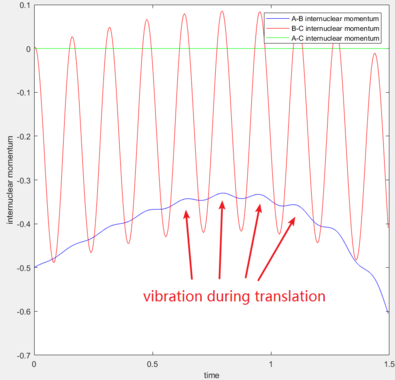
As the reaction succeeds, a large amount of potential energy is converted into kinetic energy, so the total amount of energy increases. As a result, it can be seen the most obviously that the vibrational energy of the molecule is much larger than before, for H-F bond formation releases energy which is mainly given to the vibrational energy:

Discuss how the distribution of energy between different modes (translation and vibration) affect the efficiency of the reaction, and how this is influenced by the position of the transition state.
The Polanyi's empirical rules states that for a late-transition reaction, the vibrational mode is more important in promoting the reaction, i.e. the rate of reaction is very sensitive to the vibrational mode of an endothermic reaction. From the experiments above, it can be found that for a reaction with a high efficiency, the allowed window for vibrational energy is much smaller than that of translational energy, and sometimes even a small change in vibrational mode would totally change the outcome.[2] In addition, the two windows for the two motions are related, and the higher total energy, the narrower windows. Contrarily, the reactions with early transition state is more tolerant about the window, because the total energy needed to overcome the barrier is much lower, so that the chance of recrossing the barrier due to excess energy is lower and the window is wider as a result. In other words, the later transition state, the narrower vibrational mode window.
Reference
1.IUPAC Gold Book - transition state theory [Internet]. [cited 2017 May 5]. Available from: http://goldbook.iupac.org/html/T/T06470.html
2.Polanyi JC. Concepts in reaction dynamics. Acc Chem Res. 1972 May 1;5(5):161–8.


