MRD:jw4116
H-H-H system
Ng611 (talk) 12:49, 8 May 2018 (BST) In future, consider adding a brief introductory section just outlining what you did and why,
1. What value do the different components of the gradient of the potential energy surface have at a minimum and at a transition structure? Briefly explain how minima and transition structures can be distinguished using the curvature of the potential energy surface.
The gradient of potential energy with respect to one component of inter atomic distance ri represents the equilibrium bond position of a diatomic system and is equal to zero (∂V(ri)/∂ri = 0) and any perturbation from this position will result in an increase in energy. A transition state also has a gradient with respect to both interatomic distances of 0. It represents a maximum along the minimum energy path of the reaction and can be determined by taking second derivatives and solving for a saddle point. A saddle point exists if one second derivative is positive and the other is negative: ∂2V(r1)/∂r12 < 0, ∂2V(r2)/∂r22 > 0.
2. Report your best estimate of the transition state position (rts) and explain your reasoning illustrating it with a “Internuclear Distances vs Time” plot for a relevant trajectory.
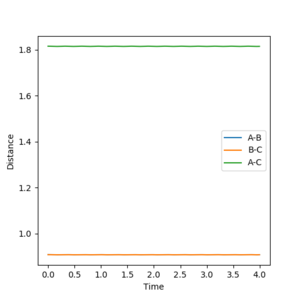
Through trial and error, it was found that the interatomic distances are 0.908 Å for r1 and r2 which implies at these distances, there is no vibration energy driving the reaction towards either the reactants or products. Therefore at these distances, the atoms remain stationary with respect to eachother and neither a Ha-Hb or Hb-Hc bond is formed.
Ng611 (talk) 12:53, 8 May 2018 (BST) Is the above graph from a trajectory calculation or an MEP calculation?
3. Comment on how the mep and the trajectory you just calculated differ.
The mep (minimum energy path) provides a simplified perspective of the minimum energy trajectory taken when the reaction proceeds in a certain direction. In contrast, the dynamics contour plot demonstrates that; in reality, the bond vibrates away from the equilibrium distance which is seen as an oscillation from the minimum potential energy. This is due to the mep not calculating the new velocity of the atoms in the system after each time step but setting it to zero, therefore no exchange of energies and vibrations are seen. The mep simply describes which direction the reaction will tend to under the given conditions.
4. Complete the table by adding a column with the total energy, and another column reporting if the trajectory is reactive or unreactive. For each set of initial conditions, provide a plot of the trajectory and a small description for what happens along the trajectory.
| Trajectory | p1 | p2 | Reactivity |
|---|---|---|---|
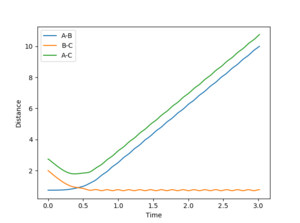
| 1 | -1.25 | -2.5 | Reactive |
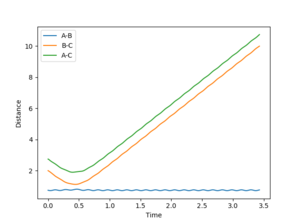
| 2 | -1.5 | -2.0 | Unreactive |
| 3 | -1.5 | -2.5 | Reactive |
| 4 | -2.5 | -5.0 | Unreactive |
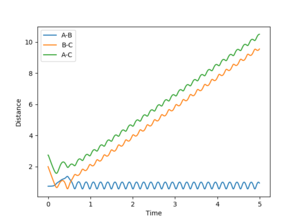
| 5 | -2.5 | -5.2 | Reactive |
 |
 |
 |
 |
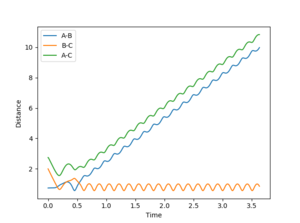 |
1: Reaction occurs as incoming atom has enough momentum to displace the old one and form a new bond.
2: No reaction as the atom does not have enough momentum to form a new bond.
3: The momentum of the incoming atom has been increased enough for the reaction to commence and the bond to form.
4: This trajectory represents a situation when the incoming atom falls just short and fails to overcome the energy barrier to emit one of the bonded atoms. However; it has enough momentum to significantly distort the target molecule and cause a large stretch in the bond length.
5: This situation represents again a successful reaction but under conditions that only just drive the reaction to completion. This is seen as the target molecules bond length distorts and vibrates away and back towards the equilibrium bond length before the bonded atom is emitted and the new molecule forms.
5. State what are the main assumptions of Transition State Theory. Given the results you have obtained, how will Transition State Theory predictions for reaction rate values compare with experimental values?
The Transition State Theory assumes there is some quasi-equilibrium between the reactants and the transition structure/complex which occurs at a saddle point along the potential energy surface. [1]
It's main assumptions are [2]:
1: The transition structure/complex will form products if it has crossed the critical dividing surface from the reactant side. This boundary is determined as the saddle point of the potential energy surface.
2: The Boltzmann distribution of energy of reactant molecules stays constant during the reaction.
3: Molecules which cross the critical surface from the reactant side and form the transition complex will have a Boltzmann distribution of energy which relates to the temperature of the system.
This deviates from our model as seen by trajectory 4, 5. In both examples the transition structure/complex is shown to form but with two different final pathways for the system. Trajectory 4 shows the reformation of the reactants and 5 shows the system being driven towards the products. Ng611 (talk) 12:53, 8 May 2018 (BST) A little more detail here would be useful. What assumption specifically is being violated? Always remember to state the obvious.
F-H-H system
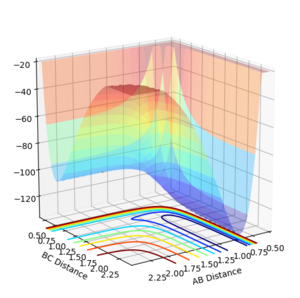
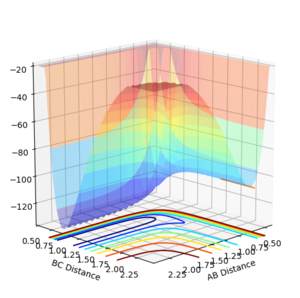
1. Classify the F + H2 and H + HF reactions according to their energetics (endothermic or exothermic). How does this relate to the bond strength of the chemical species involved?
Through examining the potential energy surface plots for both reactions, we can see that the potential energy of the products (HF) or reactants (H+HF) have an lower bond energy then their respective counterparts.
 |
 |
Approximate bond enthalpies according to the internet[3]:
HH: 432 kJ.mol-1
HF: 565 kJ.mol-1
For H + HF -> HH + F, the reaction is endothermic ΔH= 133 kJ.mol-1
For H + HH -> HF + F, the reaction is exothermic ΔH= -133 kJ.mol-1
Ng611 (talk) 12:59, 8 May 2018 (BST) Generally try to use textbooks or papers rather than websites.
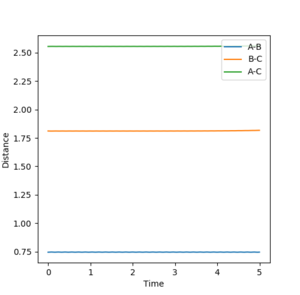
2. Locate the approximate position of the transition state?
As before, the transition state was located through trial and error. The F-H distance is 1.8112Å and the H-H distance is 0.7441Å which do no change with time if there is no energetic driving force as seen in the figure below.
3. Report the activation energy for both reactions.
Using values from software and bond lengths from the internet [4] so results will be in kcal.mol-1
The potential energy of the transition state is -103.75 kcal.mol-1. We can calculate the value of activation energy by comparing the energy cost for each of the reactants to achieve these states.
When starting with, HH + F, initial potential energy is -104.02 kcal.mol-1; therefore the activation energy is 0.27 kcal.mol-1.
For the reverse reaction, the initial potential energy is -134.03 kcal.mol-1; therefore the activation energy is 30.28 kcal.mol-1.
4. In light of the fact that energy is conserved, discuss the mechanism of release of the reaction energy. How could this be confirmed experimentally?
The conservation of energy law states that the total energy of the universe is fixed, therefore no energy can be created or destroyed but must can converted between different forms of eachother.
In this example, energy is converted between potential energy between atoms and kinetic/ translational energy . As the F atom approaches the distance between it and the target H atom slowly decreases. The speed of the F decreases as its kinetic energy is converted into potential energy as the F atom begins to interact with the H atom. As the system approaches the transition state, the potential energy approaches a maximum and the kinetic energy a minimum. After the system passes the transition state and the reaction is exothermic, the further formation of the HF bond causes a massive drop in potential energy between the two atoms which is transferred to the leaving H atom as kinetic energy hence an expected increase in temperature. This reaction can be confirmed to have occured through an IR analysis of the products and the heat evolved can be determined with calorimetry . This energy interconversion is illustrated in figure 5:

5. Discuss how the distribution of energy between different modes (translation and vibration) affect the efficiency of the reaction, and how this is influenced by the position of the transition state.
Polanyi's rules allow for one to determine to what extent does a particular energy source contribute to the effectiveness of a reaction. This all depends on where the transition state lies in relation to the reactants or products. If there is a late transition state such as for H + HF, then the vibrational energy will dominate the transition structure therefore an intially large amount of vibrational energy will promote this kind of reaction. On the other hand, if the transition state is early, the translation energy of the incoming atom will dictate the efficiency of the reaction.
Therefore the method in which energy is introduced to the system affects the efficiency at which the reaction occurs. For example, from the reactants F + HH to the products,the transition state for F-H-H requires a small gain in vibrational energy to achieve therefore sufficient translational energy will effectively allow the system to achieve the transition complex and form the products. The other example of H + HF has a large vibrational energy gap as the reactants lie much lower in potential energy, therefore a large amount of vibrational energy is required to climb the potential wall, achieve the transition state and emit the F atom.
Ng611 (talk) 12:59, 8 May 2018 (BST) Good explanation. Adding a trajectory or two as examples would have improved things further.
- ↑ IUPAC, Compendium of Chemical Terminology, 2nd ed. (the "Gold Book") (1997). Online corrected version: (2006–) "transition state theory".
- ↑ I.N.Levine - Chemistry Department Brooklyn College, New York, Physical Chemistry 6th edition, McGraw Hill Higher Education
- ↑ http://www.wiredchemist.com/chemistry/data/bond_energies_lengths.html
- ↑ http://www.wiredchemist.com/chemistry/data/bond_energies_lengths.html
