MRD:juliettejjr115
Molecular Reaction Dynamics
Exercise 1: H + H2 system
Question A
Question: What value does the total gradient of the potential energy surface have at a minimum and at a transition structure? Briefly explain how minima and transition structures can be distinguished using the curvature of the potential energy surface.
The total gradient of the potential energy surface at a transition structure is shown as a saddle point, where ∂V(r1)/∂r1 ∂V(r2)/∂r2=0, and therefore the gradient of the potential energy is zero [1]. The transition state is found at the maximum on the minimum energy path. This signifies that if we move in one direction only (e.g. decreasing AB bond distance as reaction proceeds) we observe a maxima at the transition state, however moving only in the other direction (potential energy) we observe a minima. This means it is both a maximum, and a minumum, but as the partial differentiates are =0, we say this is a saddle point [2].
The energy minima show stable, quasi-stable species, for example the reactants, products and possible intermediates [3], The total gradient of the potential energy surface at a minimum is also equal to zero, where ∂V(ri)/∂ri=0.
Question B
Question: Report your best estimate of the transition state position (rTS) and explain your reasoning illustrating it with a “Inter-nuclear Distances vs Time” screenshot for a relevant trajectory.
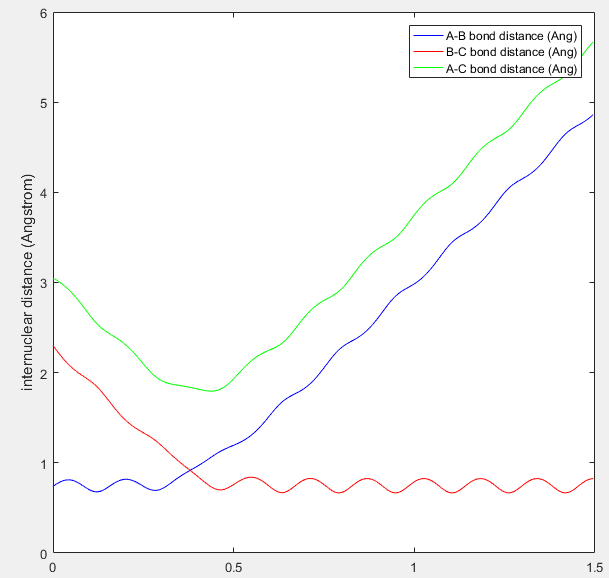
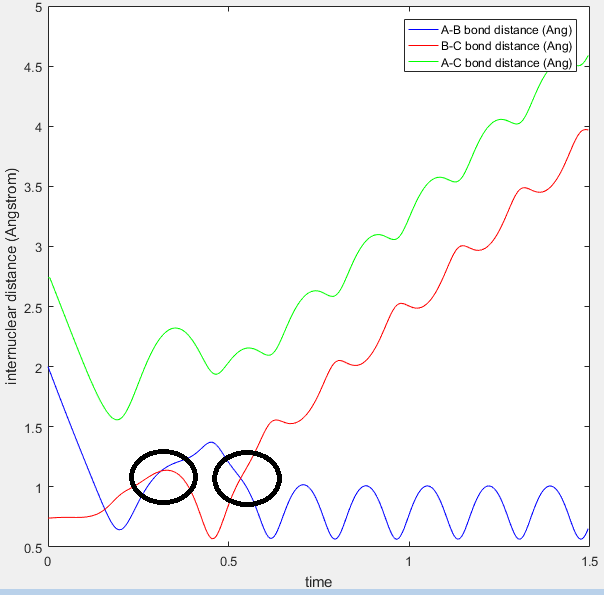
As mentioned above, the transition state is found at the saddle point as the maximum on the minimum energy path. I believe that the best estimate of the transition state position (rTS) is found along the minimum energy path (-98.8 kcal/mol) when the initial momentum is set to zero and r1=r2, i.e. the inter-nuclear distances are set to equal. The value at which they are equal is found by looking at the inter-nuclear distances Vs time plot, as seen in figure 1.
Figure 1: internuclear distance (Angstrom) Vs Time plot, the crossing point between blue and red waves is where the transition state can be found.
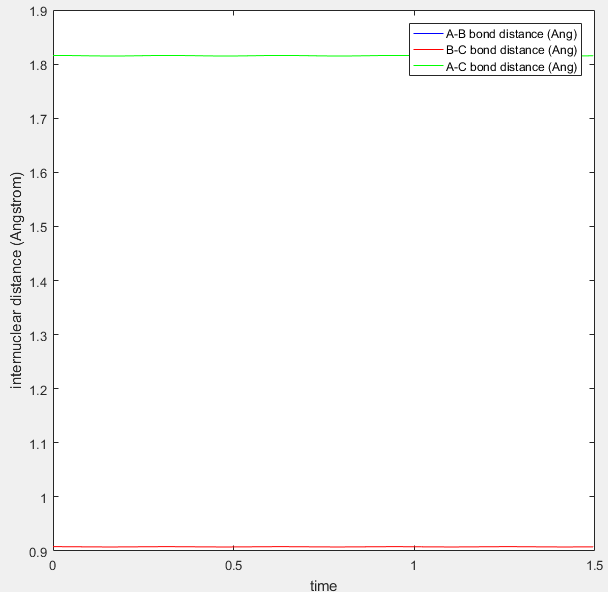
Figure 2: Internuclear distance set so that two waves stop oscillating.
From this plot you can see that the r1=r2 at around 0.91Å. The values of r1 and r2 where then set to this length, and momentum set to zero. This starts the trajectory at the transition state and allows it to remain there forever in order to determine the location of the transition state. The value equating r1 to r2 was then optimized using trial and error until the two waves became completely linear in the internuclear distance Vs time plot, as seen in figure 2.
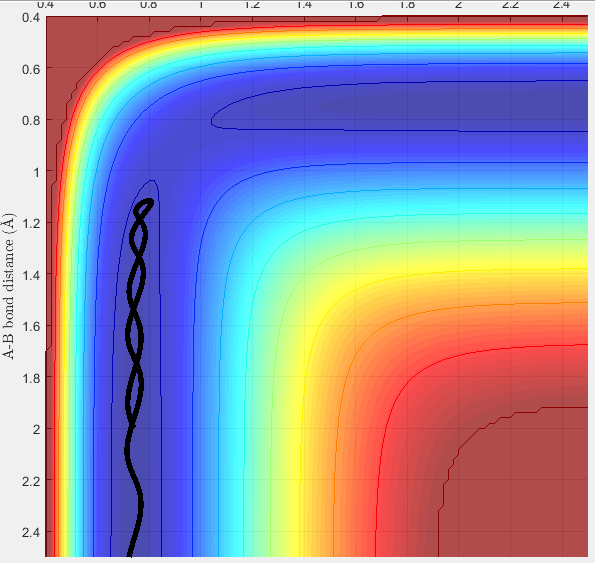
Figure 3: my best estimate of the position of the transition state, as shown on a surface plot.
At this stage, the internuclear distances were found to be 0.908Å at the transition state. Figure 3 shows my best estimate of the location of the transition state, to be 0.908Å at the maximum of the minimum energy path (-98.8 kcal/mol).
Question C
''Question: Set initial conditions such that the system is slightly displaced from the transition state and zero initial momenta, compare the how the mep and the trajectory calculated dynamically differ.
initial conditions used: r1=rts+0.01=0.908+0.01=0.918 r2=rts=0.908
Both the mep and the trajectory calculated with Dynamic calculation types both show how the trajectory follows the valley floor towards the products. The mep calculation (see figure 4) does not provide any information on the motion of the atoms during the reaction, however the dynamic calculation shows an oscillating, 'wavey' curve (see figure 5). This calculation provides more information on the motion of the atoms, as it involves the vibrations in r1 and r2 as the respective distances change (r1 decreases and r2 increases, as product AB is formed and gains vibrational energy) as the reaction proceeds.
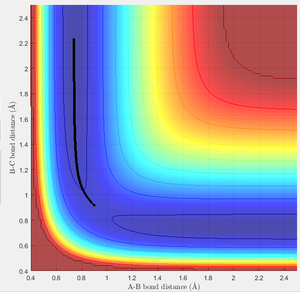

MEP calulations are based on the intrinsic reaction coordinate method, which is based on the curvature and arc length of the reaction path. Computational chemists use the corresponding steepest descent curve from the first order saddle point, and the intrinsic reaction coordinate method uses mass weighted coordinates along this mass weighted coordinates [4]. The MEP therefore always looks for the lowest energy point, neglecting the possibility of vibrations. This is why we also analyse dynamic calculations, that do take vibrations of the reactants and products into account, observed as a wavy line.
The same initial conditions were used to plot the internuclear distances Vs time plot and the internuclear momenta vs time plot. From these plotss, the final values of the positions and the average values of the momenta can be found for large t, as seen in Table 1 and Table 2 bellow.
| r1(t) | 5.28Å |
| r2(t) | 0.75Å |
Final values of the positions at large t
| p1(t) | 2.48 |
| p2(t) | 1.26 |
Final values of average momenta at large t
When the initial conditions are swapped around (i.e. r2=rts+0.01=0.908+0.01=0.918, and r1=0.908), the respective values of final positions and final average momenta swap around as well, as seen in table 3 and 4 below.
| r1(t) | 0.75Å |
| r2(t) | 5.28Å |
Final values of the positions at large t when initial conditions swapped
| p1(t) | 1.26 |
| p2(t) | 2.48 |
Final values of average momenta at large t when initial conditions swapped
^^ all this probably not important
Question D
Question: determine if the following trajectories are reactive or unreactive using the given set of initial conditions
using the following positions:
| r1 | 0.74Å |
| r2 | 2.0Å |
Then using the following momenta combinations to observe whether the trajectory is reactive or unreactive:
| Combination | p1 | p2 | Outcome of trajectory |
|---|---|---|---|
| A | -1.25 | -2.5 | Reactive |
| B | -1.5 | -2.0 | Unreactive |
| C | -1.5 | -2.5 | Reactive |
| D | -2.5 | -5.0 | Unreactive |
| E | -2.5 | -5.2 | Reactive |
Looking at trajectory A:
Trajectory A is reactive, because the trajectory passes through a transition state (the saddle point of the potential energy surface) and proceeds towards the products (see figure 6). This is seen as the entrance channel shows the vibration of molecule BC, and the exit channel shows the vibration of the AB product molecule, as r1 decreases and r2 increases during the course of the reaction. The conditions given allow the reaction to take place, with enough energy to overcome to transition state energy barrier at approx -98.3 Kcal/mol.
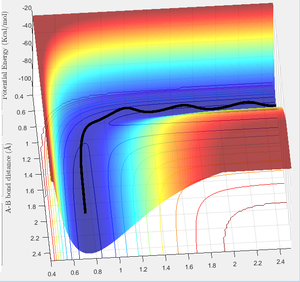
Looking at trajectory B:
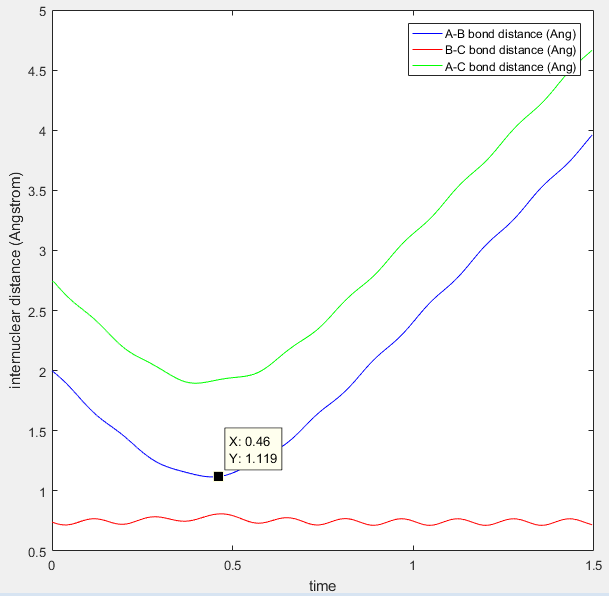
Contrary to trajectory A, Trajectory B is found to be unreactive. Figure 7 below shows how the A-B bond distance decreases (as hydrogen A approaches molecule BC) but bounces back from the transition state as reactants instead of proceeding with the reaction. The reactants therefore bounce off the transition energy barrier (or perhaps the surroundings) and molecule AB is not formed. The atoms therefore remain in the initial valley, and fail to pass over the energy barrier. From this we can assume that the P(AB) momentum is not large enough to overcome the transition state energy barrier.
Figure 8 bellow shows an animation of this trajectory. It can be seen that the molecule A approaches molecule BC, but does not react with the molecule. Instead it bounces off in the same direction it came.
The point that the trajectory reaches before bouncing off can be found by analyzing the Internuclear Distance Vs Time plot (see figure 9 below). It can be seen that the B-C bond distance is constant (vibrations due to oscillating molecule) and that the A-B distance is a minimum at 1.12Å. It then increases again and never crosses over with the red line (B-C) distance. The transition state is therefore not reached.
Figure 7 - Surface plot of trajectory B, showing reactant molecules arriving to transition state and bouncing back with the same vibration as BC reactant molecule.
Figure 8 - Animation of trajectory B. Tile (i) shows molecule A approaching BC, Tile (ii) shows molecule A reaching a certain point and changing direction, bouncing away from the molecule intact in Tile (iii).
Figure 9 - Internuclear Distance - Time plot showing point at which reactant bounces off activation energy barrier.
Looking at trajectory C:
Similar to reaction A, this trajectory is reactive. Figure 10 shows how the reactants proceed towards the products, travelling over the energy barrier. However in this case, the P1 has been increased to -1.5, and this causes greater oscillation in the molecules (compare waveyness of curves in figure 10 and figure 6.

Looking at trajectory D:
Trajectory D illustrates barrier recrossing, where the system crosses over the transition state border however reverts back to the reactants, as seen in figure 11 below.
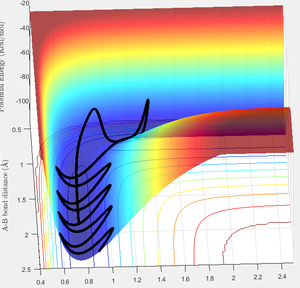
This can be analysed further as an animation, where the bond is clearly formed (see animation in figure 12 below) but then atom C comes back to reform BC bond, resulting in the reformation of the reactants.
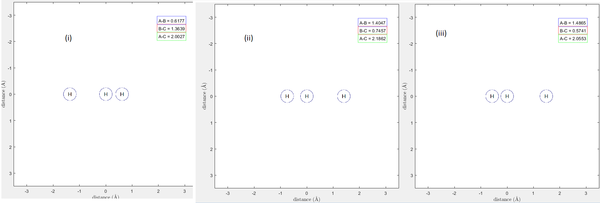
Looking at trajectory E:
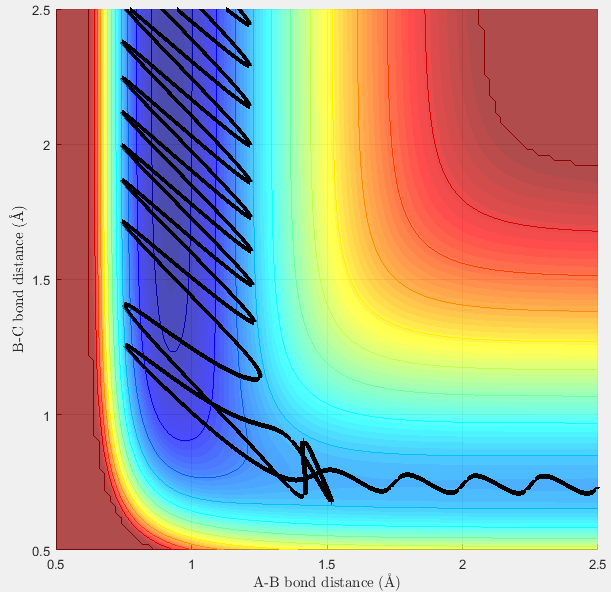
Trajectory C shows an interesting trajectory, where it seems as though the barrier recrossing occurs, but instead of staying as the reactants, the reformed BC and A molecules cross over the barrier again to eventually end up as AB and C products (see figure 13). I believe that this case is different from the previous trajectory as the P2 momentum is greater, allowing for the system to eventually cross over the energy barrier and end up in the product valley. From figure 14, you can see that the AB and BC bond distances overlap twice, representing the repeated crossing of the transition state.
Figure 13 - Surface Plot of Trajectory E, showing recrossing of the transition state barrier twice.
Figure 14 - Internuclear Distances Vs Time plot showing time at which transition states are crossed twice before eventually proceeding down the products valley.
Question E
Question: State what are the main assumptions of Transition State Theory. Given the results you have obtained, how will Transition State Theory predictions for reaction rate values compare with experimental values?
Transition state theory (TST) is used to explain reaction rates of chemical reactions to understand how the reaction occurs and via which routes. TST was developed to overcome limitations of Arrhenius rate law theory, which neglects mechanistic considerations and formation of reactive intermediates. TST is based on examining the saddle point of a potential energy surface (the transition state) and the understanding that activated complexes are in quasi-equilibrium with the reactant molecules, and form the product molecules upon crossing this transition state. The theory pictures a reaction between reactants and products going through the formation of an activated complex in a rapid quasi-equilibrium. [5]The theory has assumptions described in the list below, that also give rise to certain limitations.
1. Firstly, the TST assumes that each intermediate has a life time that is long enough to reach the Boltzmann distribution of energies before proceeding to the products. This means that in certain elementary reactions, the TST will fail if the intermediates are in fact short-lived. This is problematic in multi-step reactions where each elementary step passes through an intermediate with varying life times, and experimental values will vary to theoretical calculations.
2. Secondly, TST assumes that the atoms in these elementary steps behave according to classical mechanics. The reaction coordinate is therefore an individual degree of freedom and can be separated from the other variables in the system. This assumption also means that a reaction will occur if the atoms collide with enough energy to form the transition state, which according to quantum mechanics is not accurate. Quantum mechanics [6]. state that there is a finite probability that particles can tunnel through an energy barrier, therefore this assumption can break down, as some of the reactants will tunnel through the barrier and form the products even if they do not collide with sufficient energy. As the height of the activation energy barrier decreases, this probability of tunneling increases and therefore the TST breaks down for small energy barriers. Tunneling will be important with light particles (e.g. tunneling between acidic and basic groups allow for fast proton transfer). Tunneling means that experimental reaction rates will be greater than theoretical ones, as a certain proportion of molecules will tunnel across the energy barrier to form the products and these won't be accounted for in theoretical calculations.
3. The TST also assumes that the reaction travels through the transition state before forming the products, at the lowest energy saddle point of the potential energy surface [7] (where potential energy is at a maximum). This creates a limitation at higher temperatures, where higher vibrational modes are populated, and collisions become more complicated to model. This gives rise to the formation of transition states that are not at the lowest energy saddle point. The experimental values will be different to the theoretical ones, as at higher temperatures they travel via different activated complexes. However this limitation is not major, as once the lower level theory TS is found, re-optimizing the structure using computational chemistry will allow the higher energy TS's to be calculated.
4. The TST assumes that trajectories that cross the transition state will not recross it to find thermal equilibrium as the products or the reactants.
5. A major assumption is that the observed rate constant is approximated by the equilibrium rate constant.
6. An important assumption is that the activated complex (the transition state) is always in quasi-equilibrium with the reactants, even if the reactants and products are not in equilibrium themselves. At any given point in time, a few activated complexes will exist, some as they travel left to right in the reaction and some travelling right to left (see equation below). The concentration of these two 'species' of transition states are said to be equal. It is assumed that the flux of activated complexes in either direction direction are independent of each other. [8]
Exercise 2: F-H-H system
Question A
Question: Classify the F + H2 and H + HF reactions according to their energetics (endothermic or exothermic). How does this relate to the bond strength of the chemical species involved?
Classifying these two reactions can be done by analyzing figure 15 below.
Figure 15 - reaction pathway of F + H2 -> H + HF
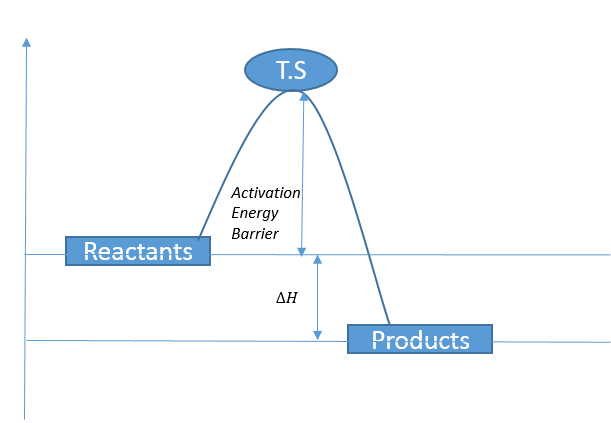
This shows the reaction F + H2 --> HF + H, and shows that the reaction travels via a transition state energy barrier. From this figure it is clear that the products (HF+H) are at a lower potential energy than the starting reactants, and this is a clear sign that this is exothermic reaction, as energy is lost. Below is a quick summary diagram (figure 16) of how this works.
Figure 16 - a basic overview of an exothermic pathway.
This figure is a very simplistic view of an exothermic pathway, which corresponds exactly to the cross section seen in figure 15. We see that if the reactants collide at the particular energy of the transition state (shown as a small 'bump' energy barrier on figure 15) the activated complex will convert to the products and release energy (usually as some form of heat).
This is also used to classify the reaction going in the opposite direction, H + HF --> F + H2, as it is just the inverse reaction of the diagram above, going from right to left. This clearly indicates that this reaction is endothermic as the products (formerly the reactants on the diagram, F + H2) are at a higher energy ground state than the products, and therefore energy is absorbed from the surroundings, noted as a change in enthalpy.
This was confirmed when looking at the potential energy Vs Time plots for both reactions. Figure 17 shows how potential energy overall decreases as the reaction proceeds, releasing energy to the surroundings. In a reverse manner, figure 18 shows how the potential energy sees an overall increase as energy is taken from the surroundings and absorbed into the system in order to form the relative products in the reverse reaction.
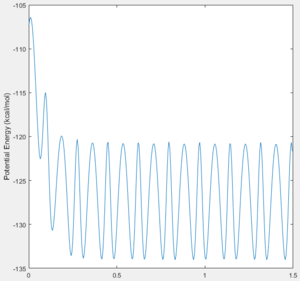
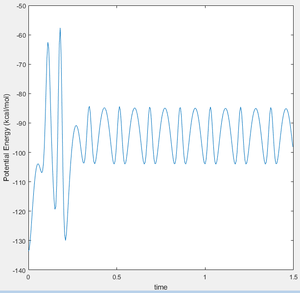
The exothermic reaction can be related to bond strength, where the formation of HF bond releases energy as it is a stronger bond than the reactant hydrogen molecule (H-H 432 kJ/mol compared to H-F 565 kJ/mol) (Bond enthalpy values [9] ) There is a net energy release as more energy is released than is required to break the initial bond.
This is therefore the same case for the reverse reaction, where the breaking of the strong H-F bond requires more energy than the energy released by the formation of the H-H bond and therefor there is a net gain in energy, defined as an endothermic process. H-F is a very strong bond due to fluorine high affinity for hydrogen, due to its high electronegativity.
Question B
Question: Locate the approximate position of the transition state
To locate the transition state, I have zoomed in on the surface plot when p1 and p2 = 0 and the bond lengths set to r2 = 0.74 Å and r1 = 1.8Å (r1 determined via trial and error, chosen as a suitable bond length as any shorter the point is no longer at the observed maximum corresponding to the transition state). The steps was set to 10 to get an accurate point on the plot. See figure 19 for a rough estimate by eye.

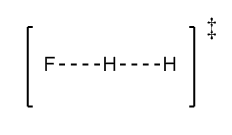
When zooming in, the most precise location found was at BC length (H2) = 0.743Å and the AB length (F -- H) as 1.796Å, this can be seen in figure 20 below . This is consistent with the bond lengths of H-H and H-F, where the transition state shows the bond forming of the H-F and the bond breaking of the H-H bond (when reaction goes in H2+F --> HF +H direction). Figure 21 is a diagram of what the transition state would potentially look like. In the first H2+H example above, the transition state was located where these two lengths were equal. In this case one must factorise in the fact that fluorine-H bond will be larger than the H-H bond due to the larger size of fluorine, therefore it makes sense that the transition state occurs at these bond lengths.

We can see from the coordinates that the transition state is closer to the reactants than the products. This is indicative of an exothermic reaction according to Hammond's Postulate. Since the reactants and the transition state only have a very small energy difference, Hammond's Postulate states that the transition state will resemble the reactant species as the inter conversion will involve only small reorganization of molecular structures[10]. This is therefore an early transition state where the higher energy reactants (relative to products) appears very close to the transition state soon after the reaction begins [11].
I then analysed these conditions using an inter-nuclear Distance Vs time plot, shown in tile (ii) figure 22. At this point you can see that the green line representing the A-C (F-H-H span) distance is constant at this point as a flat line at Y=2.543, which is the sum of the two bond lengths determined above. I believe that this is the best estimate for my transition states, where F-H=1.79Å and H-H=0.74Å.

The three plots in figure 22 show variation around the transition state. the central tile (ii) shows the internuclear distance Vs time plot at the transition state where the green line is constant. To confirm that this was the transition state, I varied the AB and BC distances while keeping the momentum = 0. Tile (i) has the transition state distance AB increased by 0.005Å and BC kept constant. The line is curves as if the path is rolling towards the reactants, before the transition state point. In tile (iii), A-B was decreased by 0.005Å and B-C transition state bond distance increased by 0.005Å. The line is curved showing it is rolling towards the products and is therefore beyond the transition state. These two variations show how coordinates in figure 20 are a good estimate for the transition state in comparison with adjacent points in the reaction pathway.
Question C
Question: Report the activation energy of both reactions
To analyse the activation energy of both reactions, a reactive trajectory was found. This was done via trial and error and using basic knowledge of the atoms present. For example, it is known that the mass of fluorine is 9 times more than hydrogen, and therefore the momentum was altered accordingly.
F + H2 --> HF + H
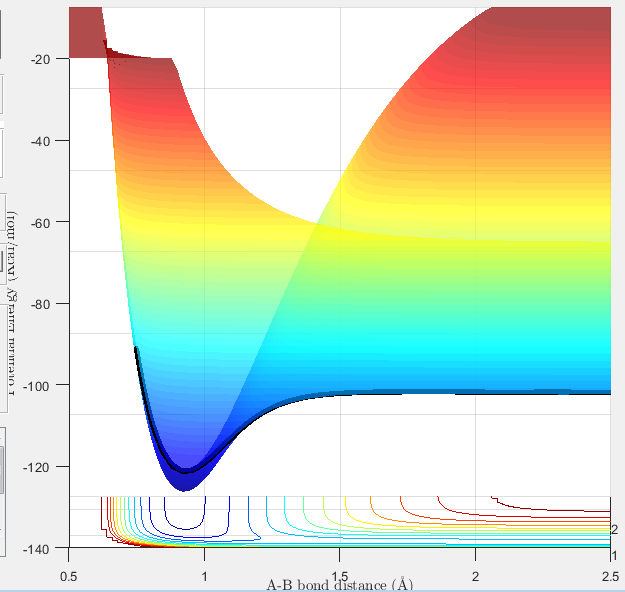
For the activation energy in this case, we look for the potential energy difference between the located transition state [1.796,0.7473] and the reactants. The energy at the transition state was found to be (looking at figure 20 above) -103.3 Kcal/mol. To assign the energy of the reactants, I have looked at the entry channel energy level looking at the energy where BC bond length = 0.74Å (ass seen in figure 23)
Figure 23 - coordinates of reactant entry channel.
From this diagram, the reactant energy levels was deemed to be -103.4 Kcal/mol. The difference between these two values, the activation energy, is therefore +0.1 Kcal/mol. However since this was all determined without mathematical analysis, there would be a +/- value associated with both the reactant energies, transition state energies and therefore the energy difference calculated.
HF + H --> H2 + F
For the activation energy in the reverse reaction. The same rational can be used but by finding the minimum point of the reaction, i.e. the thermodynamically more stable reactants on the right hand side of figure 19 above. By zooming in and finding the lowest point, (see figure 24 below) the energy of the HF + H reactants was found to be -126.6 kcal/mol (where the Y value corresponds to the HF bond length).
Figure 24 - Energy at exit channel of reaction for HF + H --> H2 + F, and therefore represents energy of H2+F (reactants for reverse reaction)
The activation energy for the reverse reaction was therefore found to be 23Kcal/mol. This larger gap is indicative of an endothermic reaction.Again, mathematical analysis would be needed to quantify error in this estimated value.
Question D
In light of the fact that energy is conserved, discuss the mechanism of release of the reaction energy. How could this be confirmed experimentally?
During a collision, the energy change is an interplay between kinetic and potential energy. The reaction will start with its energy in its potential form (as it is at high energy compared to the products) and the reaction will proceed via an energetic mechanism where this potential is converted into vibrational and kinetic energy. This is the basis of the law of conservation of energy, where by the total energy of an isolated system remains constant; it is not created or destroyed. The energy will convert into different types of energy but the total energy will remain the same.
In this reaction, the energy starts off as potential energy and is converted into vibrational and kinetic energy as it approaches the transition state. This is observed in figure 25 below as a wavy line. The trajectory shows initial vibrations in r2 as the BC molecule vibrates until the transition state in the entrance channel. The transition state is the key point in the mechanism of the energy release, as the ratio between vibrational and kinetic energy will determine whether or not the reaction will proceed towards the reactants (where vibrations in r1 will be observed as molecule AB is formed and in turn has an interplay between vibrational and kinetic energy) or the reaction will bounce back as an unreactive trajectory, bouncing back from the barrier and the reactants regenerate.
Figure 25 - example of a reactive trajectory. In this case, the reactant system possesses a ratio of vibrational and kinetic energy that allows the transition state barrier to be overcome and products formed. AB = 3.0 BC = 0.72 AB momentum = -3 AC momentum = -2 (found via trial and error).
This can be seen in figure 26 below, which shows the change in potential energy as the trajectory above proceeds. There is a clear indication that the total potential energy decreases as the reaction proceeds.
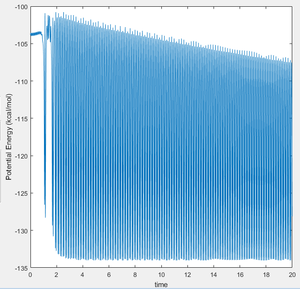
This interplay between different modes of energy can be quantified and analysed experimentally with IR spectroscopy, to analyse the difference in AB and BC vibrations. It is clear from figure 25 that the products have greater vibrational energy than the reactants. For example, H-H IR spectroscopy [12] shows two modes of vibration at 4100 and 5300cm-1, and H-f IR sprectoscopy [13]show vibrational modes of 400cm-1 and 4000cm-1. This is in agreement with the vibrations observed in the trajectory for this reaction. Another experimental technique would be to use calorimetry to find the net change in energy between the reactants and the products. Calorimetry would quantify the change in heat energy, which at constant pressure (e.g. bomb calorimetry) is equal to the change in enthalphy and therefore the free energy change of the system.
Question E
Question: Discuss how the distribution of energy between different modes (translation and vibration) affect the efficiency of the reaction, and how this is influenced by the position of the transition state.
From figure 25, it is clear that the products have a greater vibrational energy than the reactants. This agrees with the conservation of energy as the loss of potential energy means an increase in vibration energy as they interplay between each other, and kinetic energy (translational modes). There is also a clear case of barrier crossing. I believe this occurs because the high energy vibrations allow the products to pass back over the transition state barrier to form the reactants, before ending up as the most thermodynamically stable form as HF - H. This means that the reaction is inefficient, as the barrier is recrossed. An efficient reaction would not show this effect, as reactant molecules would be converted to product molecules and they would not cross back over.
In terms of the influence on the position of the transition state, this is an example of where the transition state theory breaks down. As mentioned in explaining the limits of the TST, one of the assumptions is that the reaction travels via the transition state before forming the products via the lowest energy saddle point. However at high temperatures (e.g. exothermic reactions) where higher vibrational modes are populated, transition states are formed that aren't at the lowest saddle point possible.
The TST also assumes that the reaction travels through the transition state before forming the products, at the lowest energy saddle point of the potential energy surface [7] (where potential energy is at a maximum). This creates a limitation at higher temperatures, where higher vibrational modes are populated, and collisions become more complicated to model. This gives rise to the formation of transition states that are not at the lowest energy saddle point. The experimental values will be different to the theoretical ones, as at higher temperatures they travel via different activated complexes. However this limitation is not major, as once the lower level theory TS is found, re-optimizing the structure using computational chemistry will allow the higher energy TS's to be calculated.
References
<references>[5]
- ↑ 1.0 1.1 W. Quapp, M. Hirsch, O. Imig & D. Heirdrich, Leipzig, Germany, 1998, Journal of Computational chemistry vol. 19, No. 9, pp.1087-1100
- ↑ 2.0 2.1 K. Kunisch, G. Leugering, J. Sprekels & F. Troltzsch, Springer Science and Business Media, 2007, Chapter. 7.1,pp. 362
- ↑ 3.0 3.1 B. M. Smirnov, S. R. Berry, Springer Science and Business Media, 2007, Phase Transitions of Simple Systems, Chapter. 1, pp. 14
- ↑ 4.0 4.1 R. Crehuet & J. M. Bofill, The joural of Chemical Physics, 2005 Vol. 122, doi: hhtp://dx.doi.org/10.1063/1.1927521
- ↑ 5.0 5.1 P.W. Atkins & J. De Paula, Oxford University Press 2009. Physical Chemistry, 9th edn. Chapter 22, 'Reaction Dynamics'
- ↑ 6.0 6.1 P. Pechukas, Department of Chemistry, Columbia University NY, Ann. Rev. Phys. Chem., 1981, Vol. 32, pp.159-77.
- ↑ 7.0 7.1 P. L. Houston, Dover Publications 2012, Chemical Kinetics and Reaction Dynamics, Chapter 3.4, pp.102
- ↑ 8.0 8.1 H. Eyring, "The Activated Complex in Chemical Reactions", 1935, J. Chem. Phys. Vol.3, No.2, pp.107-115.
- ↑ 9.0 9.1 G. Carruth & E, Ehrlich, Bond Energies. Volume Library Ed. 2002. Vol. 1
- ↑ 10.0 10.1 G. S. Hammond, J. Am. Chem. Soc. 1995, Vol. 77, No. 2, pp334-338
- ↑ 11.0 11.1 A. Yarnell, Chemical & Engineering News, 2003, Vol. 81, No. 20, p42
- ↑ 12.0 12.1 L. O. Paulson & D. T. Anderson* , J. Phys. Chem. A, 2011, Vol. 115, No.46, pp 13346–13355
- ↑ 13.0 13.1 M. Mosiadz, K.L. Juda, S.C. Hopkins, J. Soloducho, B.A. Glowacki, Thermochimica Acta, Vol. 513, Issues 1–2, 2011, pp.33-37

