MRD:js6815
Introduction
In this exercise, transition states, reaction coordinates and potential energy surfaces of reaction between an atom and a linear diatomic molecule is studied. In particulary, H + H2 system and H-F-H systm are investigated. The products of which are a new diatomic molecule and atom. The reaction trajectories are calcluated by two methods, which are mep and dynamics.
Exercise 1: H+H2 system
In this exercise, the H, H2 collision is investigated. Initial condition of a reactive trajectory is firstly used. (r1(0)=0.74 r2(0)=2.30, momenta p1(0)=0, p2(0)=-2.7) The concept of transition state and minima of potential energy surface is studied below:
Question 1: What value does the total gradient of the potential energy surface have at a minimum and at a transition structure? Briefly explain how minima and transition structures can be distinguished using the curvature of the potential energy surface?
Answer:
The total gradient of the potential energy surface at a minimum is zero. That is the lowest point of potential energy curve. The total gradient at a transition structure is also zero. The transition state is the maximum point on the minimum energy path.
The minimum point of potential energy surface diagram and the maximum point of minimum energy path can be distinguished by second derivative of the corresponding curve at these points. The point corresponds to transition state has a second derivative which is smaller than zero while the minima has a second derivative that is greater than zero.
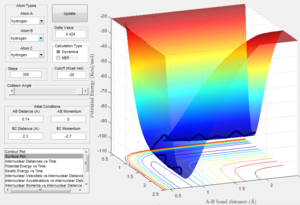
The minimum point of potential energy curve:
The point that represents transition structure on a potential energy curve:
Nf710 (talk) 10:35, 9 June 2017 (BST) This is only in the reaction coordinate. so you have to get this by taking normal modes of the reaction.
locating the transition state
The H + H2 surface is symmetric, therefore the transition state must have r1=r2. In theory, if the trajectory is started on the ridge, then it will never fall off to either side. We also know there should be almost no vibrational energy in the transition state. With these information, the position of transition state can be estimated:
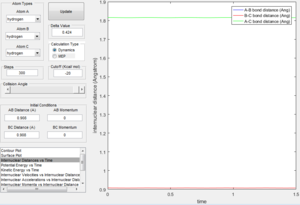
Question 2: Report your best estimate of the transition state position (rts) and explain your reasoning illustrating it with a “Internuclear Distances vs Time” screenshot for a relevant trajectory.
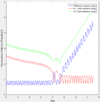
Answer: the momentum is set to be zero and different value of r has been tested. The best estimation I've got is 0.908 A. That is the bond distance where the vibrational energy is almost zero and two horizontal straight lines are shown on an Internuclear distance vs Time graph (Fig:2). That's because molecules at transition state should have almost no vibrational energy.
Trajectories from r1=rts+δ, r2=rts
Since the transition state has been located, the reaction path can be calculated when one of the H-H bond distance is slightly longer than that in transition state. Two different calculation methods, mep and Dynamics, are used and compared below:
Question 3: Comment on how the mep and the trajectory you just calculated differ.
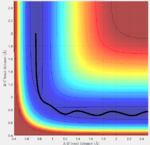
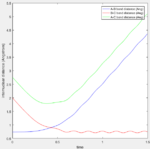
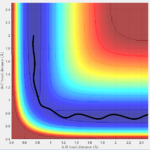
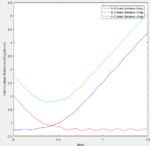
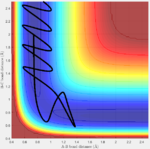
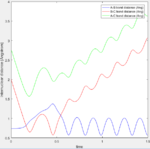
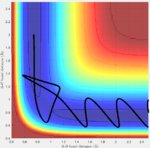
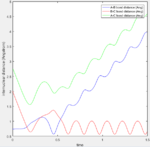
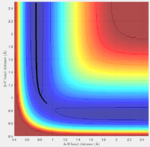
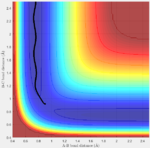
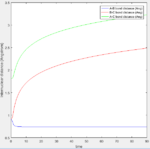
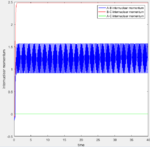
Answer: the number of step is increased to 18,000 to obtain a complete mep. Both mep and dynamic calculation are shown (fig:3 for mep and fig:4 for Dynamics). The mep calculation gives a smooth curve. That is because in mep calculation the velocity if always reset to zero after each time step. So atoms move in an infinite slow motion. What that means is the vibrational motion of the atoms are ignored in this algorithm. However, in dynamics calculation, it provides a realistic account of the motion. Therefore a sinusoid fashion curve is observed, which indicates the oscillating of atoms. The vibrational energy is taken into account. When actually doing the calculation, dynamics takes a longer time than mep. That is what we would expect since dynamics calculation includes more parameters.
| Fig:3 trajectory calculated by mep | Fig:4 trajectory calculated by Dynamics |
|---|---|
|
|
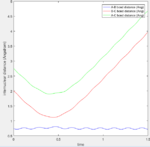
The Internuclear Distances vs Time plot and Internuclear Momenta vs Time plot for both calculation methods are recorded below (mep:fig:5 and fig:6; dynamics fig:7 and fig:8):
| mep calculation | dynamic calculation | ||
|---|---|---|---|
| Fig:5 Internuclear Distances vs Time | Fig:6 Internuclear Momenta vs Time | Fig:7 Internuclear Distances vs Time | Fig:8 Internuclear Momenta vs Time |
|

|

|
|
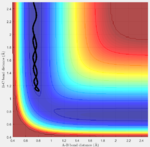
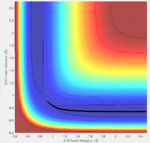
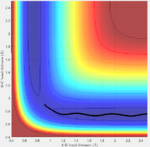
Initial conditions are set as following and calculated by both methods again: r1=rts, r2=rts+\delta, p1=p2, the potential energy surface is shown below (fig:9 and fig:10):
| Fig:9 trajectory calculated by mep | Fig:10 trajectory calculated by Dynamics |
|---|---|
|
|
This is what to be expected since now r2 is slightly longer than r1. Sp the A-B bond distance is the one that varies during the reaction.
Reactive and unreactive trajectories
From previous calculations, it is concluded that trajectories with following conditions are reactive: r1=0.74, r2=2.0, -1.5<p1<-0.8 and p2=-2.5.
The hypothesis here is all the trajectories that satisfied the above conditions but with higher value of momenta would be reactive since they have enough kinetic energy to overcome the activation barrier. The hypothesis is tested below:
Question 4: Complete the table by adding a column reporting if the trajectory is reactive or unreactive. For each set of initial conditions, provide a screenshot of the trajectory and a small description for what happens along the trajectory. Answer:
From these results it can be seen that the hypothesis is incorrect, largely because the right vibrational mode is required should too for the reaction to occur. This will be further explained below by discussing transition state theory:
Question 5: State what are the main assumptions of Transition State Theory. Given the results you have obtained, how will Transition State Theory predictions for reaction rate values compare with experimental values?
Answer:
The main assumptions of Transition State Theory are shown below[1]:
- even when the reactants and products are not in equilibrium with each other, the activated complexes are in quasi-equilibrium with the reactants.
- the flux of activated complexes in the two directions are independent of each other.
- When applied to each elementary step of a multi-step reaction, the theory assumes that each intermediates are very long-lived enough to reach Boltzmann distribution.
-The atomic nuclei behave according to classic mechanics.
-The reaction system will pass over the lowest energy saddle point on the potential energy surface.
The transition state theory in general over estimate the rate of reaction. That's because it assumes that the atom behaves only like a particle.. That means as long as atoms are given enough kinetic energy to across the activation energy barrier, the reaction must occur. However, in reality, the reactants may reach transition state many times until the reaction can occur.
The theory may underestimate the rate of reaction sometime. TST suggests that only when enough kinetic energy given can the reaction occur. In reality, for any barrier with a finite amount of energy, it's possible for the particles to tunnel across the barrier even if they do not collide with enough energy. This effect becomes significant when the activation energy barrier is low (which means more chance for the particles to tunnel through).
Exercise 2: F-H-H system
In this exercise, reaction involves one F atom and two hydrogen atoms is investigated.
PES inspection
Question 6Classify the F + H2 and H + HF reactions according to their energetics (endothermic or exothermic). How does this relate to the bond strength of the chemical species involved?
Answer:The left hand side of fig:11 corresponds to F + H2, while the right hand side of fig:11 corresponds to H + HF. Reaction from F + H2 to H + HF is exothermic reaction, since the product has a lower potential energy than reactant. So reaction from H + HF to F + H2 is endothermic (reactant has lower potential energy than product).
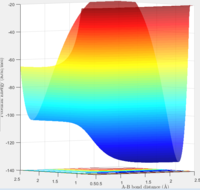
The bond strength of H-F is stronger than H-H, (436 KJ/mol for H-H bond and 568 KJ/mol for H-F bond[2]) that's why reaction from H-H to H-F is exothermic reaction.
Question 7Locate the approximate position of the transition state
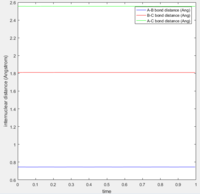
Answer: Hammond postulate is used for this question, which says the transition state of a reaction resembles either the reactants or the products, to whichever it is closer in energy. In this case the transition state is close to the left hand side of fig:11 (H2+F). That means the H-H bond in the transition state should be similar to the natural H-H bond (0.74A). From this starting point, different bond distances were tested with zero momentum and found out at the transition state H-H bond is 0.745A and H-F bond is 1.81A (fig:12, reason discussed in Question 2).
Question 8Report the activation energy for both reactions.
Answer: the activation energy in this case is the potential energy at transition state minus the potential energy of the reactant. The potential energy at transition state is -103.75 Kcal/mol(fig:13). The potential energy of H2+F system is -104.02 Kcal/mol. This is calculated by setting the distance of two hydrogen atoms as its molecular distance (0.74A) and set the fluorine atom to be as far as possible (20A). Same method is applied for HF+H system and the energy is calculated to be -134.03 Kcal/mol (0.91A bond length of HF).
| Fig 13: potential energy vs time plot of transition state | Fig 14: potential energy vs time plot of H2+F system | Fig 15: potential energy vs time plot of HF+H system |
|---|---|---|

|

|

|
So the activation energy of reaction from H2+F to HF+H is 0.27 Kcal/mol. The activation energy of reaction from HF+H to H2+F is 30.28 Kcal/mol.
Reaction Dynamics
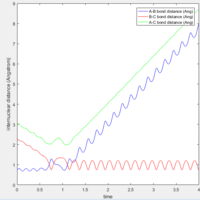
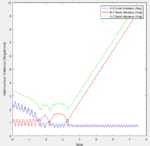
The initial conditions I found that lead to a reactive trajectory for F+H2 system is H-H bond distance 0.74 A (bond distance of H2). The distance between F and one H is 2.3 A. The momentum of fluorine atom is -2.6 N/s. From the internuclear distances vs time plot(Fig 16), it seems that two transition states occur during the reaction.
Question 9 In light of the fact that energy is conserved, discuss the mechanism of release of the reaction energy. How could this be confirmed experimentally?
Answer: as discussed this is exothermic reaction, thus thermal energy is released during the reaction. The thermal energy is released in two forms: translational energy and vibrational energy. In the potential energy surface diagram (Fig: 17), it can be seen that the vibration from entrance channel is much smaller than the vibration of exit channel, the increase in vibrational energy is due to the release of thermal energy.
Nf710 (talk) 11:33, 9 June 2017 (BST) Its the vibrational energy decays as thermal
As for translational energy, the frequency of oscillating of product is smaller than that of reactant. Assuming that the speed of oscillating is the same, then the product must propagate faster than the reactant, because the number of oscillating period is smaller in the product.
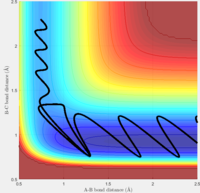
This result can be experimentally observed by chemiluminescence. Since the reaction is exothermic, photons from vibrationally excited product can be measured immediately after their formation. The intensity measured can be used to characterize the populations of vibrational states of the product molecules. It can be used to compare with the vibrational states of reactant.
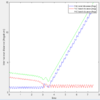
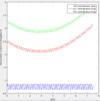
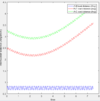
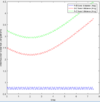
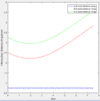
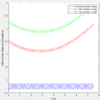
A calculation is setup on the side of the reactants F + H2. rHH=0.74, pFH=-0.5. Several values of pHH from -3 to 3 N/s are tested and shown below. It can be concluded that when momentum approaches both -3 and 3, the trajectory is reactive, when it is in the middle, then the trajectory is unreactive.
| pHH = 3.0 | pHH = 2.5 | pHH = 2.0 | pHH = 1.5 | pHH = 1.0 | pHH = 0.5 |
|

|
|
|
|
|
| pHH = 0 | pHH = -1.0 | pHH = -2.0 | pHH = -2.5 | pHH = -3.0 | |

|

|

|
|
|
Reaction of H + HF system and Polanyi's Empirical Rules
The reverse reaction, H+HF is also studied. H-F distance is set to be the bond length of H-F molecule, which is 0.91 A. The hydrogen atom is given a very large momentum initially but it does not lead to a reactive trajectory. Different parameters are tested by increasing the vibration energy of HF and decreases the momentum of hydrogen atom to HF molecule. It turns out that when the vibrational momentum of HF reaches 7.9 N/s, and momentum of hydrogen atom decreases to -0.6 N/s, with initial H-HF distance range from 2.1 A to 2.5 A, reactive trajectory is obtained (fig: 18).
Question 10 Discuss how the distribution of energy between different modes (translation and vibration) affect the efficiency of the reaction, and how this is influenced by the position of the transition state.
Answer: The question can be answered by applying the Polanyi rules, which state that vibrational energy is more efficient in promoting a late-barrier reaction than translational energy.[3] The reaction from H+HF to H2 F is an endothermic reaction, and is a late barrier reaction. That means in this case, vibrational energy is more significant than translational energy. This is proven above. When hydrogen atom was given a large tranlsational energy to collide with H-F molecule, the reaction didn't happen. However, when the translational energy of H atom decreased and the vibrational energy of HF molecule increases, the reaction can happen under certain condition.
Nf710 (talk) 11:38, 9 June 2017 (BST) You should have used the heat map ploys here to show the trajectories.
Nf710 (talk) 11:39, 9 June 2017 (BST) It is then easier to see if the in coming particle has vibrational or trnaslational energy and you can also see the position of the TS. But otherwise this is a well written and consise report.
Conclusion
From this experiment, the main observation is even if enough energy is given for the reaction to proceed, it may not happen. The vibrational mode needs to be right as well. The energy surface plot can be used to determine whether a reaction is exothermic or endothermic. The trajectory on the energy surface plot indicates whether a reaction will occur, and if so, how many times it reaches transtion state before forming the final product.
References
- ↑ Laidler, K. J., & King, M. C. (1983). Development of transition-state theory. The Journal of Physical Chemistry, 87(15), 2657–2664. doi:10.1021/j100238a002
- ↑ Carruth, Gorton, Ehrlich, Eugene. "Bond Energies." Volume Library. Ed. Carruth, Gorton. Vol 1. Tennessee: Southwestern, 2002.
- ↑ Zhang, Z., Zhou, Y., Zhang, D. H., Czakó, G., & Bowman, J. M. (2012). Theoretical study of the validity of the polanyi rules for the late-barrier Cl + CHD3 reaction. Journal of Physical Chemistry Letters, 3(23), 3416–3419. doi:10.1021/jz301649w

