MRD:jr817
H + H2 system
Dynamics from the transition state region
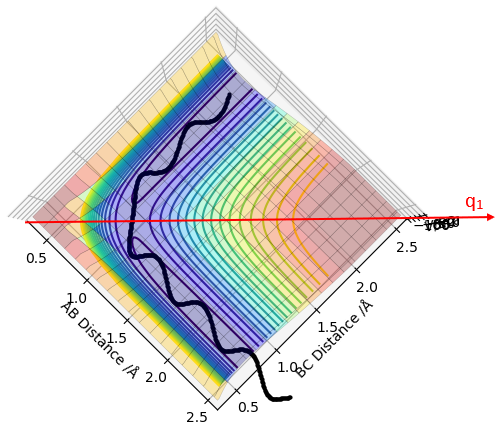
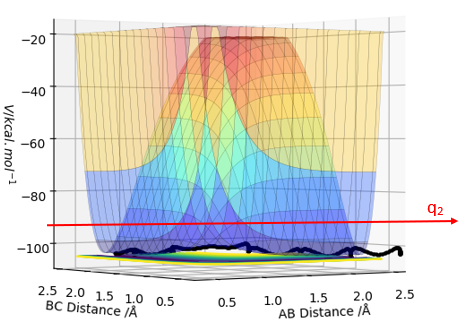
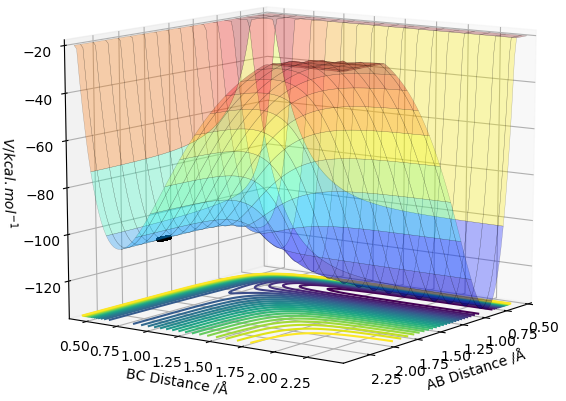
The transition state (TS) on a potential energy surface diagram (PES) is defined as the saddle point of the PES. This is identified as the point where the second derivatives of the potential energy with respect to q1 and q2 separately have non zero values and the sign of ∂2V(q1)/∂(q1)2 is opposite to the sign of ∂2V(q2)/∂(q2)2. (i.e if ∂2V(q1)/∂(q1)2 < 0, then ∂2V(q2)/∂(q2)2 > 0 and vice versa). The TS can be distinguished from local minima of the PES as the local minima would have a non zero value for only 1 of the second derivatives whereas the TS has non zero values for both. (q1 and q2 depicted in the diagrams below)
Ng611 (talk) 16:24, 7 June 2019 (BST) Hard to see what direction your q2 is going in (a top-down view would help). Otherwise, good!
Trajectories from r1 = r2: locating the transition state
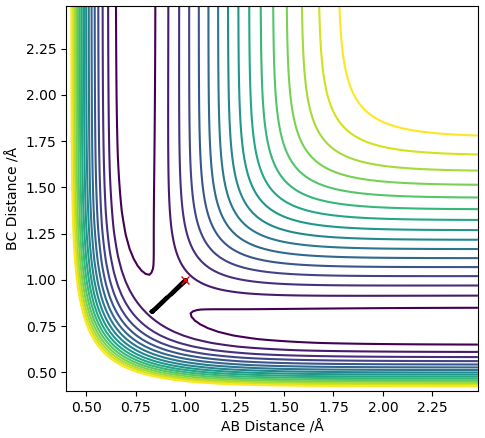
From the PES the TS was estimated to be at roughly rts = 1.0 Å, this value was put in for the distances between H atoms A-B and B-C which gave a contour plot and an inter-nuclear distances vs time plot shown below:
Contour plot with r = 1.0 Å
Inter-nuclear distances vs time plot with r = 1.0 Å
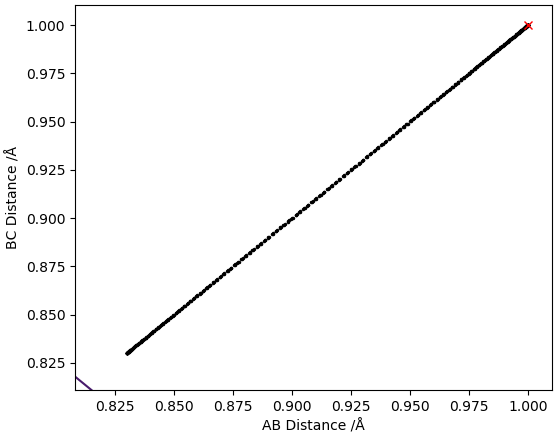
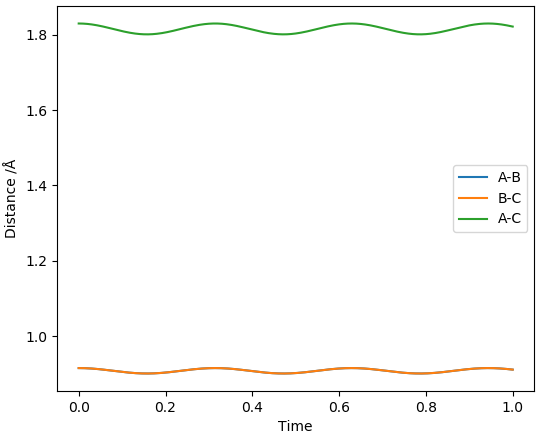
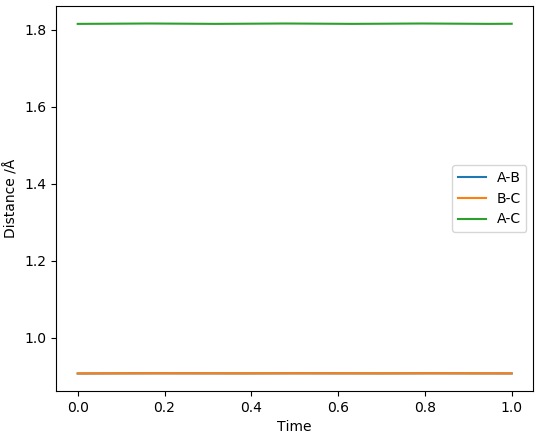
The inter-nuclear distances vs time plot shows that the distances between A-B and B-C oscillate thus the estimated value for rts was not accurate. To obtain more accurate values for rts the average of the values in the contour plot was taken and used as the new rts (ts = 0.915 Å) to generate a new contour plot and inter-nuclear distances vs time plot. This process was repeated until the plot of inter-nuclear distances vs time yielded 2 relatively straight lines.
Line in contour plot of r= 1.0 Å used to determine new rts
Plot of inter-nuclear distances vs time for r = 0.915 Å
Plot of inter-nuclear distances vs time for r = 0.9075 Å
Using this method the rts< was estimated to be 0.9075 Å.
Not exactly (I can see some residual low amplitude vibrations), but close enough.
Calculating the reaction path
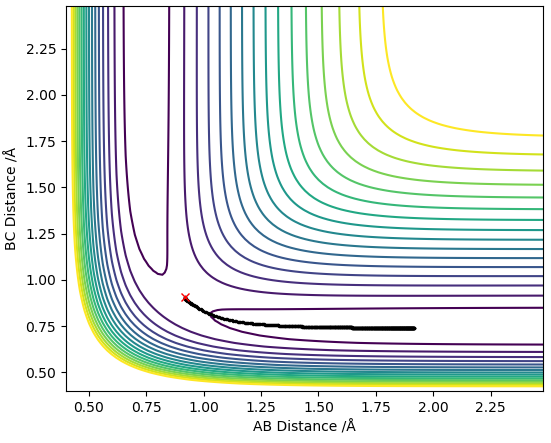
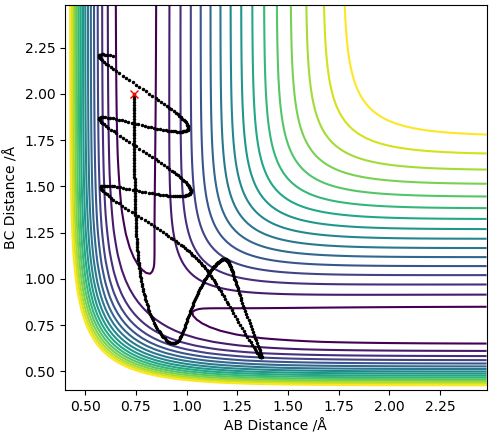
MEP contour plot
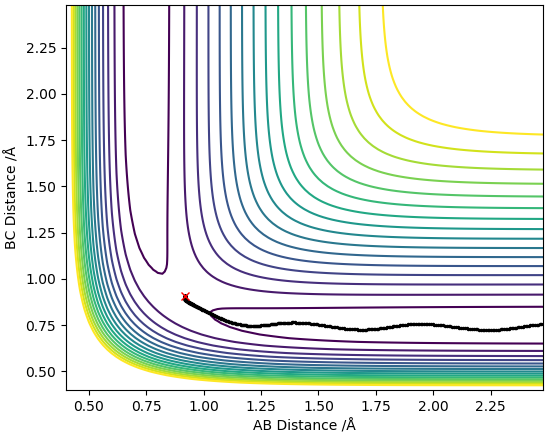
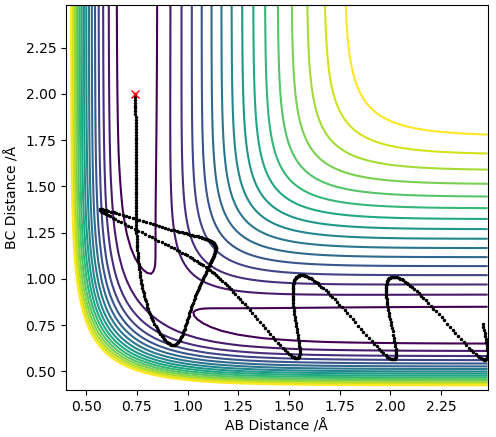
Dynamics contour plot
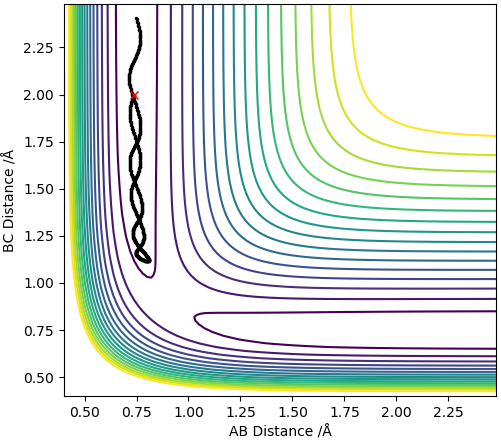
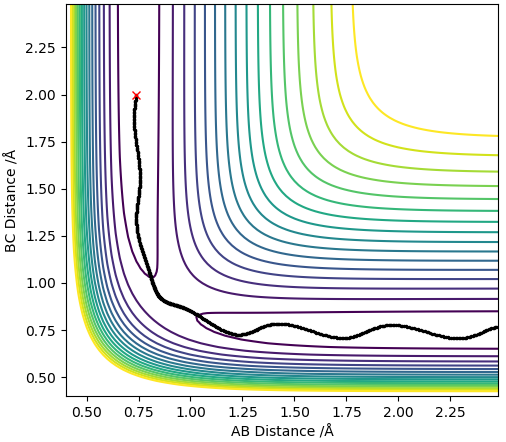
The trajectory line in the MEP contour plot is shorter than the trajectory line in the dynamics contour plot. Also, the trajectory in the MEP contour plot is a smooth line whereas the trajectory in the Dynamics contour plot oscillates. This occurs because the MEP plot doesnt take into account the momentum or inertia of the atoms (which arise due to the mass of the atoms) thus ignores the vibrational modes of the H-H molecule so the trajectory line ends when the new H-H molecule is formed and reaches requilibrium as it assumes the B-C distance no longer varies. However, the dynamics plot does take into account momentum and inertia so is affected by the vibrational modes of the H-H molecules thus gives rise to oscillations in the trajectory line, this also means that the B-C distance always changes so the trajectory line never ends.
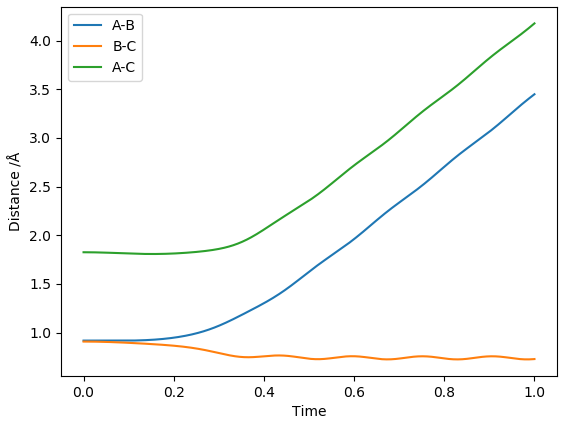
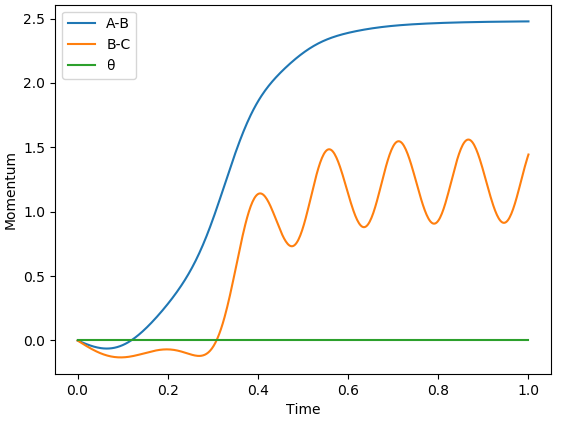
The 2 plots above show the inter-nuclear distances vs time and momenta vs time plots for when initial conditions of r1 = rts + 0.01 Å and r2 = rts are used. If conditions of r1 = rts and r2 = rts + 0.01 Å were used instead then the plot would look exactly the same, except the A-B line would be swapped for the B-C line in both plots.
With a calculation where the intial positions were set to the final positions of the trajectory calculated above and the momenta was set to the final values obtained above but with their signs reversed, the system was seen to approach its TS (i.e. r1 and r2 -> rts)
Reactive and unreactive trajectories
Transition State Theory (TST) relies on the assumptions that:
-The reactants are constantly in equilibrium with the TS
-The energy of the particles involved follow a Boltzmann distribution
-Once formed, the transition state structure cannot revert back into the reactants
Ng611 (talk) 16:26, 7 June 2019 (BST) There are two others, can you think of what they'd be?
From the table above we can see that it indeed possible for the transition state structure (and sometimes even the product structure) to revert back into the reactants (via barrier recrossing). The reforming of reactants from the TS or from product would thus result in a reaction rate lower than predicted with TST.
Ng611 (talk) 16:27, 7 June 2019 (BST) Good!
F - H - H system
PES Inspection
F + H2 Reaction
As the two reactions are the opposites of each other (i.e. a forward reaction of F + H2 is the backwards reaction of H + HF), the two reactions would share the same PES but the reaction coordinate of one reaction would be the opposite of the other. The PES of the F + H2 reaction shows that the reactants reside at the top of the ridge (indicated by the black dots on the PES above) so the reactants of the H + HF reaction would reside at the bottom of the ridge. Thus, we can deduce that the F + H2 reaction is exothermic while the H + HF reaction is endothermic. This is in line with the bond strengths of H-F and H-H as the H-F bond is stronger than the H-H bond, so the energy put in to break the H-H bond would be less than the energy released by the formation of the H-F bond.
Approximate transition state
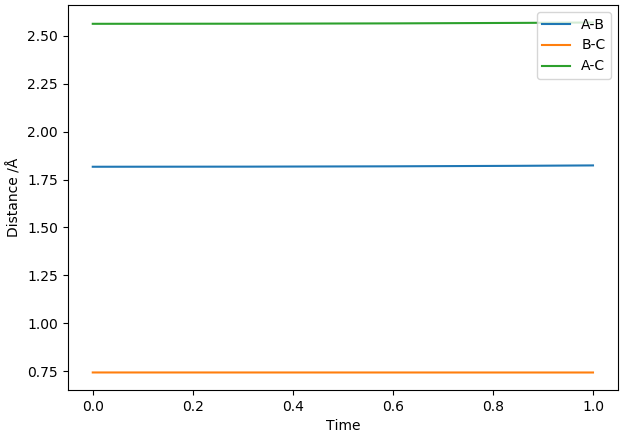
The two reactions share the same TS as they are the forward and backwards reaction of each other. By inspecting the PES and applying Hammond's Postulate, we can see that the TS would have a structure more similar to that of F + H2. Initially, the H-H distance was set to the H-H bond length (0.741 Å [1]) and the F-H distance was set to the H-F bond length (0.917 Å [1]) and the H-F bond lengths were increased in increments of 0.1 Å until relatively straight lines were observed in the plot of inter-nuclear distances vs time. This was achieved at a H-F distance of 1.817 Å.
Relatively straight lines obtained for H-F = 1.817 Å and H-H = 0.741 Å
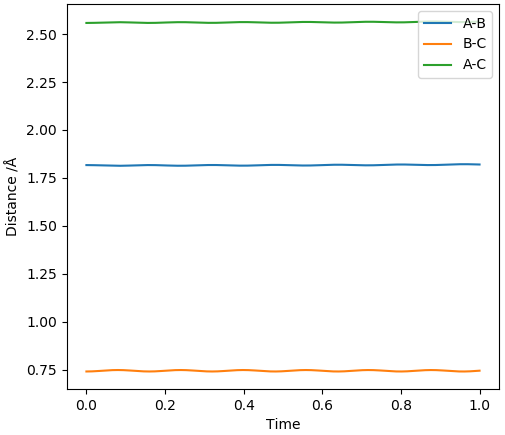
New, more accurate, distances for H-F and H-H were then read from the midpoint of the line on the contour plot and used to yield straight lines in the inter-nuclear distances vs time plot as shown below.
Thus, using this method, the H-F distance in the TS was determined to be 1.816 Å and the H-H distance in the TS was determined to be 0.745 Å.
Activation Energy for both reaction
The activation energy (Ea) of the reaction of F + H2 would be equal to the energy difference between the TS and the reactants of each respective reaction. Using the H-F and H-H distances specified above, the energy of the TS (ETS) was determined to be -103.752 kcalmol-1.
F + H2 Reaction Ea
The energy of the reactants was determined by setting the H-H distance to be 0.741 Å (i.e the bond length of a H2 molecule) and the H-F distance to be set to 3 such that its large enough to not interact with the H2. Both momenta were set to 0. Using these values, the energy of the reactants was determined to be -103.990 kcalmol-1.
Ea = |-103.752 - (-103.990)|
Ea = 0.238 kcalmol-1
H + HF Reaction Ea
The energy of the reactants was determined by setting the H-F distance to be 0.917 Å (i.e the bond length of a HF molecule) and the H-H distance to be set to 3 such that its large enough to not interact with the H2. Both momenta were set to 0. Using these values, the energy of these reactants was determined to be -133.990 kcalmol-1 .
Ea = |-103.752 - (-133.990)|
Ea = 30.238 kcalmol-1
Ng611 (talk) 16:28, 7 June 2019 (BST) Good!
Reaction Dynamics
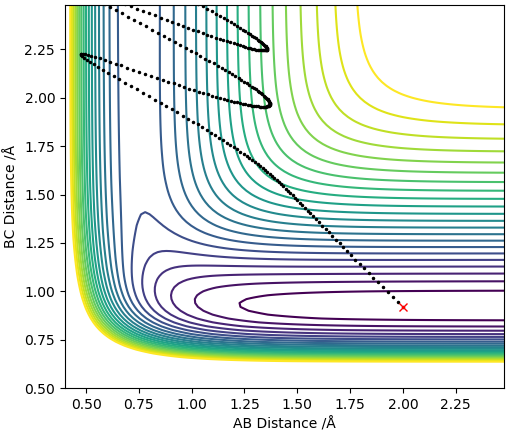
Setting the H-F distance to 1.816 Å and the H-H distance to 0.82 Å with both momenta set to 0 results in a reactive trajectory for the F + H2 reaction.
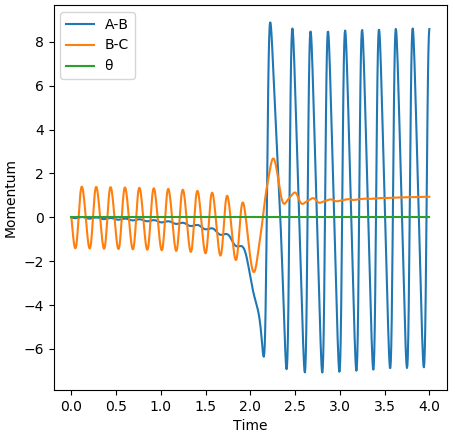
The Momenta vs time plot above shows that, at the beginning, momentum of the H2 molecule oscillates. This is due to vibrational modes in the H2 molecule. At a time of around 2.0, the F atom and H2 molecule come together and react to form the products. After this point the momentum of the HF molecule oscillates indicating that it now possesses vibrational energy while the momentum between the 2 H atoms remains constant, indicating there is not longer vibrational energy being held between them. Overall the process is that vibrational energy (in H2) is transferred into translational energy which is again transferred to vibrational energy (in HF).
To experimentally confirm that energy is conserved, the reaction could be done in a bomb calorimeter (as the reaction is exothermic) and the enthalpy change can be calculated from the change in temperature observed in the water.
Ng611 (talk) 16:28, 7 June 2019 (BST) NO! This doesn't distinguish between vibrational and translational KE. Think of a method that would!
Further calculations of the F + H2 reaction
For these calculations, the F-H distance was set to 2.0 Å, the H-H distance was set to 0.74 Å, the momentum of F-H was set to -0.5 and the momentum of H-H was varied in a range from -3.0 to 3.0, whether the reaction was reactive or not is listed in the table below.
| H-H momentum | Reactive? (Yes or No) |
|---|---|
| -3.0 | N |
| -2.9 | N |
| -2.8 | Y |
| -2.5 | N |
| -2.0 | Y |
| -1.5 | Y |
| -1.0 | Y |
| -0.5 | Y |
| 0 | Y |
| 0.5 | Y |
| 1.0 | N |
| 1.5 | Y |
| 2.0 | N |
| 2.5 | N |
| 2.8 | N |
| 2.9 | Y |
| 3.0 | N |
The table shows that the reaction is only successful for certain values of H-H momenta, it was common for barrier recrossing to occur for the reactions of high momentum that were unsuccessful. A higher momentum indicates a higher energy in the system, thus the results show that the reaction doesn't occur simply because there is enough energy in the system to overcome the activation energy.
A successful reaction was observed in the calculation ran with the same distances between the atoms but with the momentum of F-H being set to -0.8 and the H-H momentum being set to 0.1.
Further calculations of the H + HF reaction
A successful reaction for the H + HF reaction was obtained by setting the H-H and H-F distances to be 2.0 Å and 0.917 Å respectively with the H-H momentum being set to 0.5 and the H-F momentum being set to 13. The reaction trajectory can be seen in the contour plot below. A much greater momentum on the diatomic is required for this reaction compared to the reaction of F + H(sub>2, this is because the activation energy for this reaction is much larger as for this reaction to occur, the H-F bond (which is stronger than the H-H bond) must be broken.
The results obtained here can be explained by Polanyi's rules. The energy (ie momentum) in a molecule can be (among others) translational or vibrational energy and the distribution of the energy to these 2 modes and the transition state of the reaction can determine if a reaction occurs successfully or not. In the case of the the reaction of F + H2, the TS is deemed to be an early TS thus translational energy in the molecule is most effective for a successful reaction and vibrational energy is ineffective [2]. Whereas for the reaction of H + HF, the TS is a late TS so vibrational energy is most effective for a successful reaction and translational energy is ineffective [2]. This explains why, for the reaction of F + H2, a greater momentum didn't result in more successful reactions all the time - as sometimes the energy was distributed more as vibrational energy thus insufficient translational energy was available to pass the TS.
Ng611 (talk) 16:29, 7 June 2019 (BST) Good!
References
1, P. Atkins, J. Paula, in Atkins' Physical Chemistry, Oxford University Press, Oxford, 10th edn, 2014
2, J. L. Steinfeld, J. S. Francisco, W. L. Hase in Chemical Kinetics and Dynamics, Prentice Hall, Englewood Cliffs, N.J., 1st edn, 1989

