MRD:jp2517
Wiki Page J Powell
Exercise 1
Question 1
1a) How is the transition state mathematically defined on a Potential Energy Surface diagram?
On a Potential Energy Surface (PES) diagram, the transition state is defined as a saddle point - that is to say, a point in 3D space which is a minimum in one direction, and a maximum orthogonal to it.
1b) How can the transition state be identified?
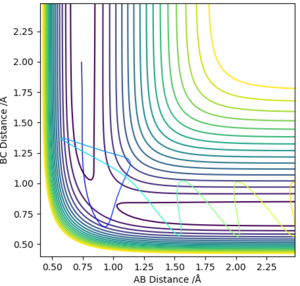
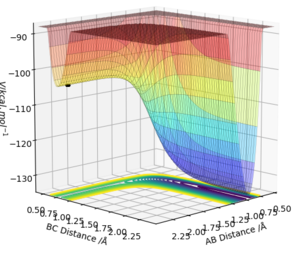
To define the saddle point, two new functions, orthogonal to each other, need to be defined. Q1 and Q2 will be parallel with the line of the minimum and maximum at the saddle point (hence why they are orthogonal to each other). Q2 and Q1 represent 45 degree rotations (it just happens that it is 45 degrees in this case, it could be a different angle) of the AB and BC axes, namely, that Q2 is the line tangential to the maximum potential energy along the minimum energy pathway, while Q1 is the line perpendicular to this, also passing through the maximum potential energy along the minimum energy pathway. The fact that they are orthogonal to each other means they provide a good basis set for all points. This setup is shown in Figure 1
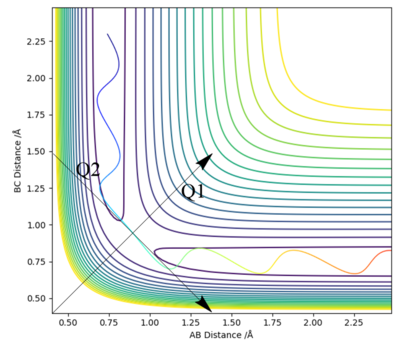
To mathematically locate the saddle point, it's necessary to find the first-order derivatives along Q1 and Q2, to locate the stationary points. In a saddle point, these will both occur at the same value. Second-order differentiation can confirm that a maximum has been found on Q2 and a maximum on Q1
1c) How can it be distinguished from the local energy minimum of the potential energy surface?
While a local energy minimum may be a minimum compared to some points around it, it may not be the global minimum. However, the local minimum can be distinguished from the global energy minimum by differentiating to find all the stationary points along a line, and comparing the values for V at which these occur. The global minimum will occur at the lowest value for V out of all the minima.
(Good.) Cq3417 (talk) 21:24, 23 May 2019 (BST)
Question 2
2. Finding a best estimate of transition state position
Hammond's postulate states that in a reaction which goes between products and reactants with a transition state, the transition state will be most structurally similar to either the reactants or products, based on which it is closer to in energy. However, this only really works if the reactants and products are very different in energy. In this example, the reactants and products are identical in energy, therefore the transition state will be exactly halfway between the two, making it the structural average of both of them.
We can therefore say that r1 = r2 at the transition state, meaning that on the contour plot, the transition state lies somewhere along the diagonal line going from bottom left to top right.
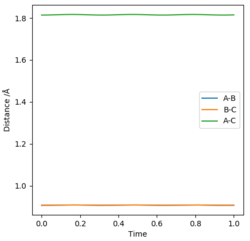
From visual inspection of the contour plot, it can be estimated that this occurs somewhere around r1 = r2 = 0.9 Å. Use of a plot of Internuclear Distance against Time can confirm that the point has been found, as when the molecules are put precisely at the transition state, they will sit there and nothing will happen, thus the plot of Internuclear Distance vs Time will show two flat lines. If the molecules are even slightly off the transition state point, they will oscillate back and forth, leading to a sinusoidal curve in the Internuclear Distance vs Time plot.
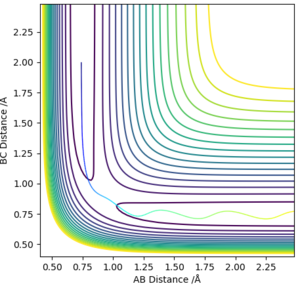
The less-efficient way to find the transition state point is to iteratively solve for r1 and r2 by trying different values for each and obtaining a progressively flatter line. The best estimate I could perform, to 3DP for the transition state, is r1 = r2 = 0.907 Å. The plot of Internuclear Distance vs Time at this value is pretty flat, but not quite perfect, as seen in Figure 2.

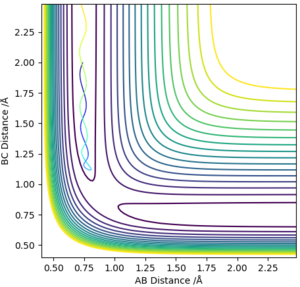
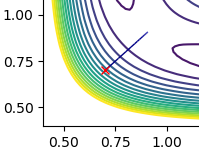
There is a better way to do this, which provides a more accurate answer, is to use the MEP (Minimum Energy Pathway). Normally, the molecule carries its momentum over when it passes the stationary point, resulting in oscillation. However, with MEP enabled, momenta and velocities are reset to zero after each infinitesimally small time step. Thus, if the molecule ends up on the transition state, a minima, it will subsequently have zero momentum and velocity in the next time step, given that the gradient at the point is zero. Thus, the molecule remains at the stationary point, and zooming in on the end of the molecule's trajectory can give us a value for r1 = r2. From this method, the value can be estimated, to 6DP, as 0.907742 Å and the corresponding plot of Internuclear Distance vs Time confirms this (Figure 3)
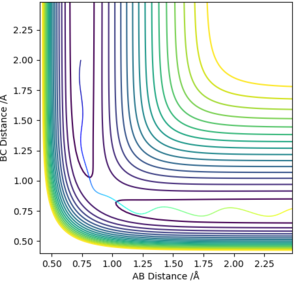
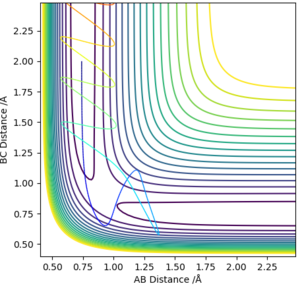
This value differs from the estimate value as it is more accurate, and the trajectory calculated is different in that it no longer oscillates, due to momentum and velocity being reset after each infinitesimally small time step. The trajectory instead stops when the molecule reaches the minimum point (Figure 4)
MEP calculations show the lowest energy pathway for the reaction, whilst dynamics analysis shows the reaction pathway. The MEP can provide the result of the location for the transition state location in terms of distances between the three atoms.
(Good illutstration.) Cq3417 (talk) 21:24, 23 May 2019 (BST)
Question 3
Complete the table above by adding the total energy, whether the trajectory is reactive or unreactive, and provide a plot of the trajectory and a small description for what happens along the trajectory. What can you conclude from the table?
The interesting conclusion from the table is that simply adding more energy to the reactants is not sufficient to guarantee a reaction. For example, the molecules react when their momenta are -1.5 and -2.5, but not when their momenta are increased to -2.5 and -5.0. This shows that the molecules also need to be in the correct vibrational state when they collide, otherwise the energy will be converted to forms not involved in bonding, such as kinetic or thermal.
Too much energy and they will simply bounce off each other, unreacted.
Question 4
State what are the main assumptions of Transition State Theory. Given the results you have obtained, how will Transition State Theory predictions for reaction rate values compare with experimental values?
Transition State Theory posits that there is a quasi-equilibrium between products and reactants at the transition state, in which molecules with sufficient energy to reach the activation barrier move between semi-reactants and semi-products before falling down one side of the transition state into reactants or products.
Its main assumptions are that:
1. Atomic nuclei behave according to classical mechanics, and that quantum tunnelling effects are negligible. Thus, that the reaction does not occur unless molecules collide with enough energy to form the transition structure.
2. Each intermediate is long-lived enough to reach a Boltzmann Distribution of energies before continuing. If they are too short-lived, the momentum of the reaction trajectory can carry over to influence the selectivity of the reaction.
3. That the reactants pass precisely over the saddle point, which is a decent approximation at low temperatures but falls down at higher temperatures as molecules will have more energy than is needed to surpass the activation barrier.
Given these assumptions, predicted reaction rate values will be greater than experimental ones as the reactions will be less efficient in reality.
(Good, any reference?) Cq3417 (talk) 13:22, 23 May 2019 (BST)
Exercise 2
Question 1
By inspecting the potential energy surfaces, classify the F + H2 and H + HF reactions according to their energetics (endothermic or exothermic). How does this relate to the bond strength of the chemical species involved?
The reaction of F + H2 to HF + H is exothermic. This is shown on the figure in that the products have lower potential energy (in essence, they are more stable) than the reactants. Applying Hammond's Postulate, we can estimate that the transition state will be early
The reaction of HF + H to F + H2 is endothermic. As shown on the diagram, the reactants are at higher energy than the products, which makes sense according to the bond strengths of the chemical species involved. The HF bond is much stronger than the H2 bond. The activated complex is most likely to be closer in structure and energy to the products than the reactants, making it a late transition state, according to Hammond's Postulate.
(Nice and clear.) Cq3417 (talk) 21:24, 23 May 2019 (BST)
Question 2
Locate the approximate position of the transition state
F + H2 to HF + H
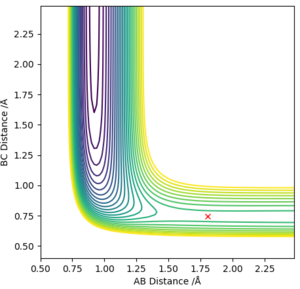
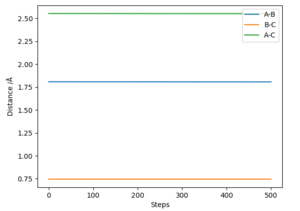
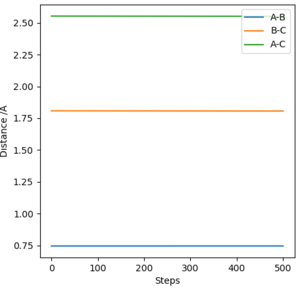
There are plenty of minima along the minimum energy pathway, however the one which corresponds to the transition state (saddle point) will be the one closest to the sharp drop in energy, which represents the energy pathway of the reaction after it has overcome the activation barrier. By using the MEP method, the transition state was estimated to lie at r1 = 1.808 Å and r2 = 0.745 Å, as confirmed by a plot of Internuclear distance vs time, which shows a flat line.
HF + H to F + H2
Given that this reaction is the same as the first one, just reversed in direction, the position of the transition state will be the same value but with r1 and r2 swapped, hence r1 = 0.745 Å and r2 = 1.808 Å
(Good plots.) Cq3417 (talk) 21:24, 23 May 2019 (BST)
Question 3
Report the activation energy for both reactions
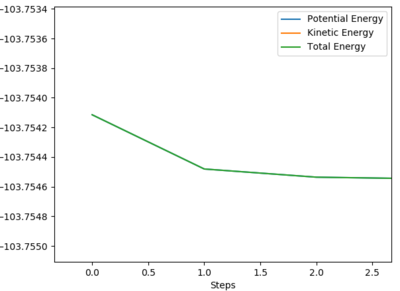
Common sense says that the activation energy for the endothermic direction will be much larger than that of the exothermic direction, due to the lateness of the transition state in the endothermic direction requiring much more energy to reach. For the endothermic reaction of F + H2 to HF + H, the activation energy can be measured by using an MEP calculation starting at a structure neighbouring the transition state; just far enough away that it spontaneously falls down the energy well (to the exothermic products), given that the structure is no longer quite at the transition state. From this, a graph of energy vs time yielded the activation energy for the reaction.
Energy of transition state: -103.752 kJmol-1
Energy of HF + H: -133.827 kJmol-1
Activation Energy (Endothermic) = +30.1 kJmol-1 to 1DP
For the Exothermic Direction, the activation energy will be very small on account of the transition state being early.
Energy of H2 + F: -103.95 kJmol-1
Activation Energy (Exothermic): +0.2 kJmol-1 to 1DP
Question 4
A set of initial conditions that results in a reactive trajectory for F + H2 is as follows:
Atom A = F, Atom B = H, Atom C = H
r1 = 2.8 Å, r2 = 0.8 Å
AB Momentum = -2.5, BC Momentum = -2.5
The momentum vs time graph for the above conditions, which produce a reaction, is as follows:
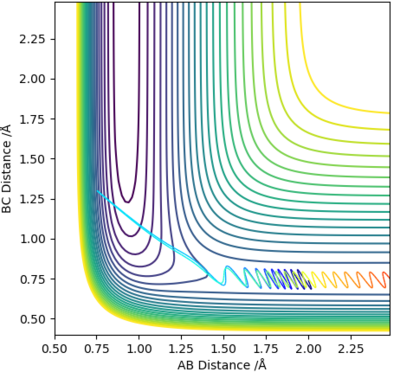
As can be interpreted from the graph, the oscillating H2 molecule approaches the F atom, appears to react before springing back and returning to the other H atom, then falling back to react to form HF. This is a good demonstration of a temporary equilibrium between reactants and products formed at the transition state. The orange line shows the vibrations of the middle atom, which become dampened as it approaches and reacts with the fluorine atom. Meanwhile, the Fluorine atom (blue line) did not previously show much oscillation but does once reacted, as energy has been transferred to it.
In light of the fact that energy is conserved, discuss the mechanism of release of the reaction energy. Explain how this could be confirmed experimentally
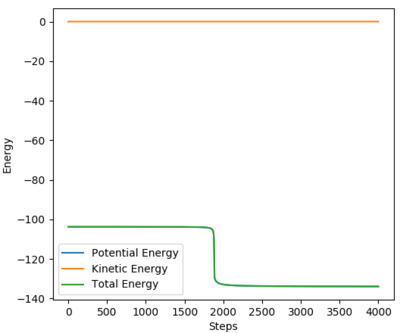
Given that this is an exothermic reaction, and that energy is conserved overall, some energy must be released into the reaction (to influence the products) and/or the surroundings. Potential energy has been exchanged for kinetic energy, which could be confirmed experimentally by calorimetry; observation of a rise in temperature as the reaction progresses. This is due to the energy released into the system/surroundings by the formation of the stronger H-F bond. These findings are shown in the image below, in which the total energy of the system remains constant while energy is converted between kinetic and potential energy.
Question 5
Discuss how the distribution of energy between different modes (translation and vibration) affect the efficiency of the reaction, and how this is influenced by the position of the transition state
Simulations were run with Atom A = F, Atom B = H and Atom C = H, starting at r1 = 1.4 Å and r2 = 0.74 Å, AB Momentum = -0.5 and changing BC Momentum between -3 and 3. It can be seen from this configuration that AB (pFH) Momentum corresponds to the translational energy of the system and BC Momentum (pHH) corresponds to the vibrational energy of the system.
It was observed that, for the exothermic reaction, low values of vibrational energy (BC Momentum) slowed the reaction or prevented it from happening.
When pHH was increased to -0.8, the reaction still occurs, however the system lingers at equilibrium longer, with plenty of recrossing of the transition barrier.
For the reverse, endothermic reaction of H + HF to H2 + F, it was observed that the reaction still happened despite very low values of p(HH), ie, translational energy, provided that there were adequate levels of p(FH), ie, vibrational energy.
Combining this with the findings of the simulations for the exothermic reaction, it can be seen that vibrational energy is much more influential in deciding the success/failure of an endothermic reaction, one which has a late transition state, than translational energy. Conversely, in the exothermic reaction, translational energy seemed to be the most important factor. It's also worth noting that the reactions seem to be more 'efficient', that is to say that there is less time spent in equilibrium at the transition state, oscillating between products and reactants before finally falling either side to one of them, when the correct form of energy for the type of transition state (early vs late) is provided.
These findings are summarised by a series of rules proposed by Hungarian Physicist Polanyi, which relate preference for an early or late transition state to the distribution of vibrational or translational energy available for the reaction of highest efficiency. Therefore, translational energy is better at promoting a reaction in which the transition state is early, and vibrational energy for if the transition state is late. [1]
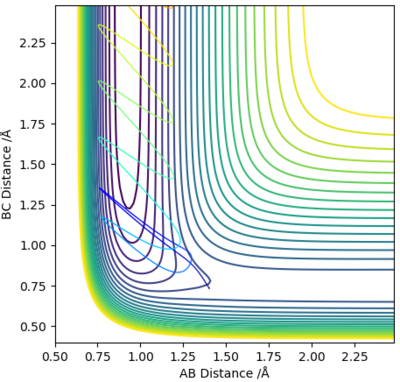
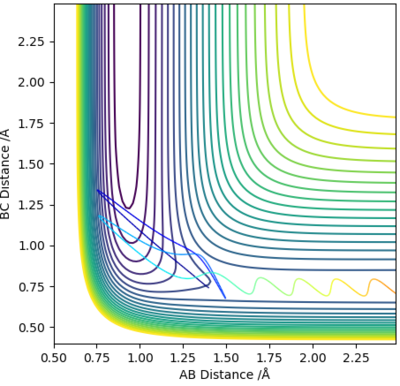
The two figures above support Polanyi's Rules; from the left image to the right image, the AB momentum of the exothermic reaction (which is the translational energy) increases from -0.5 to -0.8, and this increase in translational energy causes the reaction to happen in the right image where it didn't previously.
The two figures underneath further support Polanyi's Rule for the endothermic case, where from left to right, vibrational energy increases, and the system goes from a non-reaction to a reaction.
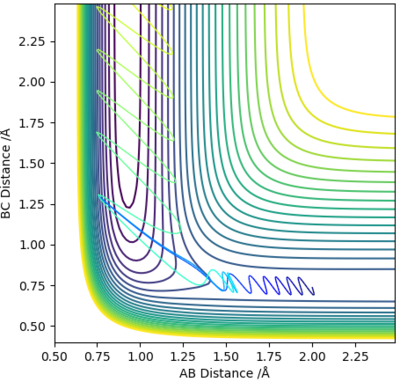
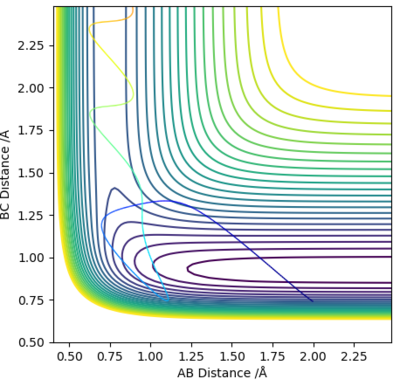
Polanyi's Rules generally apply to most cases, but don't work all the time, as there are some exceptions. In the two images below, from left to right, increasing the translational energy from 0 to 3 in the exothermic case should cause a non-reaction to react, but it actually causes a reaction to not react.
Thus, the conclusion we can draw is that Polanyi's Rules are generally quite accurate but have a few exceptions, especially when going to higher levels of either form of energy. They can be treated more like guidelines.
(Well done, I think your report shows good understanding of this concept.) Cq3417 (talk) 13:23, 23 May 2019 (BST)
References
1. Zhang, Z., Zhou, Y., Zhang, D. H., Theoretical Study of the Validity of the Polanyi Rules for the Late-Barrier Cl + CHD3 Reaction, The Journal of Physical Chemistry Letters, 2012, 3 (23), pp 3416–3419

