MRD:jo416
H + H2 System
Dynamics from the transition state region:
In a potential energy surface, the transition state is located at the saddle point on the surface. This is the highest point on the lowest energy reaction path. Along two orthogonal directions, transition states can be distinguished from minima by their second derivatives. A saddle point is characterized by a negative value for the second derivative with respect to one component and a positive value with respect to the other component. A minima would have positive values for the second derivatives with respect to both components.
(Good discussion, but what do you mean by components? Use terms like the reaction coordinate along the reaction pathway and the orthogonal coordinate. Fjs113 (talk) 20:46, 10 May 2018 (BST))
Locating the transition state:
The location of the transition state was determined by making an initial guess based on some of the properties inherent to the system and then minimizing fluctuations in internuclear distance vs. time plots. The H + H2 system is symmetrical, therefore (r1) and (r2) were kept equal throughout and the momenta were set to 0.
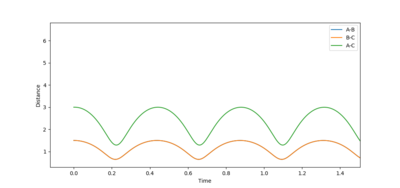
By looking at the AB and BC vectors the second guess reduced the distance to r= 0.9 Å.
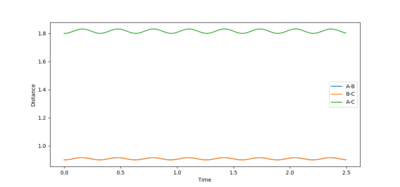
This guess led to a substantial reduction in fluctuations in the plot. The best estimate for (rts) was r= 0.908 Å. This resulted in an almost flat plot:
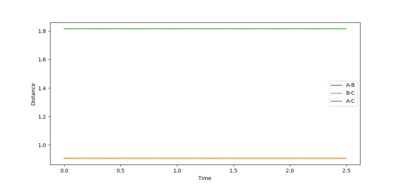
At this value the reaction pathway showed an almost completely static dot. Therefore, the transition state was found at r= 0.908 Å.

(Perfect! Good derivation. Fjs113 (talk) 20:46, 10 May 2018 (BST))
Calculating the Reaction Path:
After the transition state has been located, the trajectory the represents the reaction path or minimum energy pathway (MEP) can be determined. The MEP trajectory is determined by resetting the velocity of the system to zero at each time step. The MEP was investigated by setting the initial conditions of the system to: (r1)= (rts) Å , (r2)= (rts) + 0.1 Å, and both momenta still equal to 0. These adapted conditions result in the reaction no longer being static at TS but 'rolling' downhill.
This behavior is illustrated by the internuclear distance vs. time plot and the contour plot below:


As the internuclear distance vs. time plot shows, the MEP trajectory halts any internuclear vibrations, this is an unrealistic model of the molecules.

(This is neither a MEP nor a contour plot, but rather the Distances vs Time plot for the Dynamics equivalent. Fjs113 (talk) 20:46, 10 May 2018 (BST))
Due to the symmetry of the reaction, changing the initial conditions to: (r2)= (rts) Å , (r1)= (rts) + 0.1 Å, has no effect on the reaction dynamics apart from different bonds vibrating and changing distance.
(Good discussion showing understanding. Fjs113 (talk) 20:46, 10 May 2018 (BST))
Reactive and Unreactive Trajectories
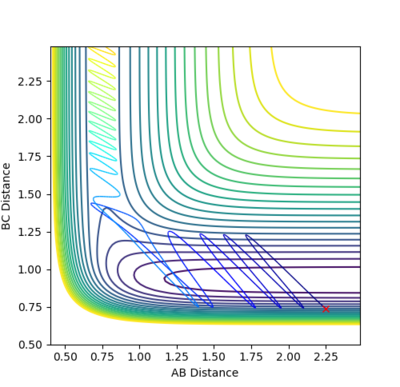
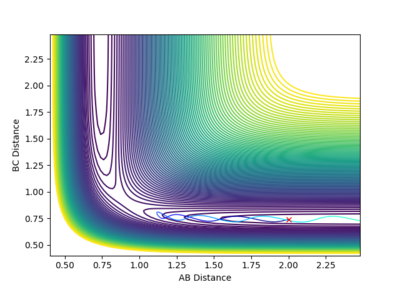
With the knowledge that reactions with the initial conditions: r1 = 0.74 and r2 = 2.0, -1.5 < p1 <-0.8, and p2 = -2.5 will pass the transition state and go to completion, it would be intuitive to suggest that any reaction with the same initial values for internuclear distance but larger momenta, would also go to completion. To investigate this assumption, a series of starting conditions were tested and their results
| p1 | p2 | Total Energy | Outcome |
|---|---|---|---|
| -1.25 | -2.5 | -99.018 | Reactive |
| -1.5 | -2.0 | -100.456 | Unreactive |
| -1.5 | -2.5 | -98.956 | Reactive |
| -2.5 | -5.0 | -83.956 | Unreactive |
| -2.5 | -5.2 | -83.416 | Reactive |



Transition State Theory
Transition state theory is the idea that a reaction can be described as a reactants forming an activated complex at a transition state, which then decays into products. It relies on a few major assumptions. The first major assumption is that the system can be treated with classical mechanics, this ignores and quantum effects. This results in the theory assuming that unless molecules collide with enough energy to reach the transition state, no reaction will occur. In reality tunneling can lead to reactions proceeding without meeting this energy requirement.
The second major assumption of the theory is that all reactions with the required energy will pass over the lowest energy saddle point and decay into products. As shown in the results above, this is not strictly true. For systems with low total energy (Fig. 7), this is the case. However, for systems with significantly higher total energies, behaviors such as barrier recrossing can be observed (Fig. 10) this is not accounted for in the theory. Furthermore, the theory does not account for the fact that there are reactions which are successful, despite not ever crossing the lowest energy saddle point (Fig. 11). This would lead to TS theory underestimating the reaction rate compared to experimental values.
(Good explanation. Well done for referring back to the previous figures. Fjs113 (talk) 20:46, 10 May 2018 (BST))
F-H-H system
Potential Energy Surface Inspection
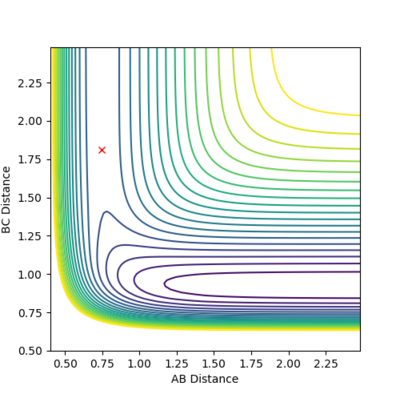
By inspection of the potential energy surfaces for the F-H-H system, insight into the reaction energetics and bond strengths of the chemical species involved could be obtained. This was achieved by An arbitrary set of conditions were used for the first surface and then r1 and r2 were reversed.
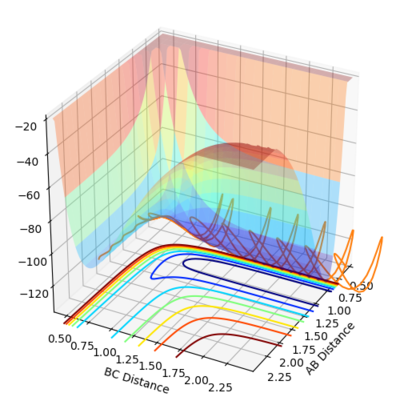

The process of locating the TS is more difficult due to the asymmetry of the reaction (i.e. r1 =/= r1). (Surely you mean r2 here ;) Fjs113 (talk) 20:46, 10 May 2018 (BST))
This process was aided by consideration of Hammond's postulate. From the information in the surfaces (fig. 12, fig. 13) the first, exothermic reaction will have a transition state closer to the reactants and vice versa for the endothermic, reverse reaction. By trial and error the transition state for the reactions were as follows:
[H2 + F -> HF + H]; rab = 1.8098 Å, rbc = 0.7454 Å

[HF + H -> F + H2]; rab = 0.7454 Å, rbc = 1.8098 Å
Activation Energy
The activation energy for the reactions were determined by finding the difference between the energy at the transition state and the energy where rab was very large.
For the reaction to form HF: Ea = + 0.44 kcal/mol (lit. 0.7-3.4 kcal/mol, the inaccuracies reflect the limitations of transition state theory.)
For the reaction to form H2: Ea = + 17.1 kcal/mol
(Where did you get these values from? This could be illustrated using a MEP Energy vs Time plot showing the drop in potential energy. Fjs113 (talk) 20:46, 10 May 2018 (BST))
Reaction Dynamics
Initial conditions of: rab = 2.0 Å, rbc = 0.74 Å; pAB = -0.40, pBC = -1.41, were determined to result in a successful reaction to form HF.
(Where did you get these initial conditions from? Was it an informed guess? Did you use the inversion of momentum procedure?Fjs113 (talk) 20:46, 10 May 2018 (BST))
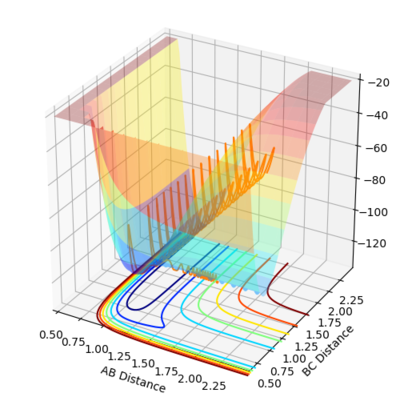
A plot of energy vs. time shows the conservation of energy through the reaction (symmetry) and that the reaction results in an increase in kinetic energy and a reduction in energy. An increase in kinetic energy means an increase in vibrational energy which is converted into heat energy. This could be measured by calorimetry.
(Did you really mean "reduction in energy"? It would've been better if you elaborated slightly more on the increase in kinetic energy -> translational/vibrational. Fjs113 (talk) 20:46, 10 May 2018 (BST))
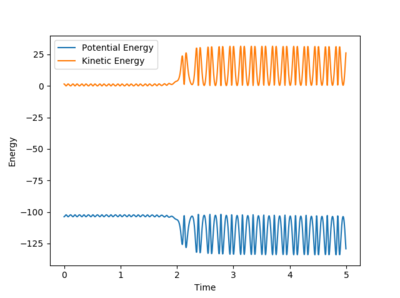
A new calculation was set up with the initial conditions rHH = 0.74, rHF = 2.40, pHF = -0.5, and -3< pHH <3. Several values for pHH in the range were investigated. Towards the extreme limits of the inequality it was found that the reactions had so much vibrational energy that they passed the transition state before returning to the reactants.
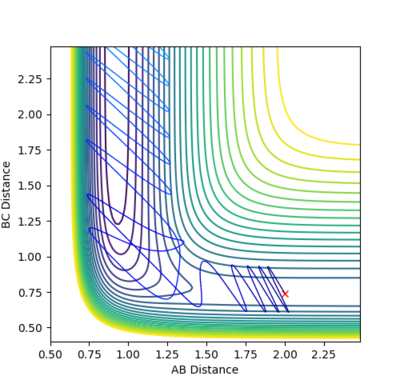
(As far as I can see, this reaction does not return to the reactants. Fjs113 (talk) 20:46, 10 May 2018 (BST))

When the initial conditions were adjusted to pFH = -0.8 pHH = 0.1, the reaction went to completion.

Focusing now on the reverse reaction, to form H2. The initial conditions: rHH = 2.25, rHF = 0.74, pHH = -0.739, and pHF =0.098. This resulted in a reactive trajectory. This was obtained by reducing the value for pHH from an arbitrarily high value and increasing the other momentum from a low value.
This behavior illustrates how the vibrational energy of H-F follows Polanyi's empirical rules. The late transition state means that increasing the vibrational energy of H-F will make it easier to cross over the transition state barrier. High translational energy would result in the reaction initially crossing the TS before returning to reactants. For an early transition state the behavior is reversed.
