MRD:jl7816
Molecular reaction dynamics
Exercise 1
What value do the different components of the gradient of the potential energy surface have at a minimum and at a transition structure? Briefly explain how minima and transition structures can be distinguished using the curvature of the potential energy surface.
At a minimum, the gradient only has one component, either ∂V/∂rAB= 0 or ∂V/∂rBC= 0. The curvature at the minima is positive and the secondary derivative is positive.
Not really true. At a local minimum, you still have to look at it from two components. It just the gradients of both of the components are zero and secondary partial derivative are both positive (coz it is minimum at both components). It has nothing to do with the curvature either. If you are not sure, please have a look this video link--Sw2711 (talk) 11:37, 21 May 2018 (BST)
At a transition structure, the gradients of both components rAB and rBC are equal to 0. The secondary derivative of one component is positive and the other is negative, this is called a saddle point.
I think you meant one component is the reaction coordinate and the other is the diagnoal of AB/BC plane. --Sw2711 (talk) 11:37, 21 May 2018 (BST)
Report your best estimate of the transition state position (rts) and explain your reasoning illustrating it with a “Internuclear Distances vs Time” plot for a relevant trajectory.
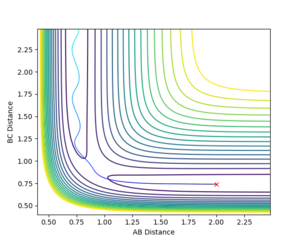
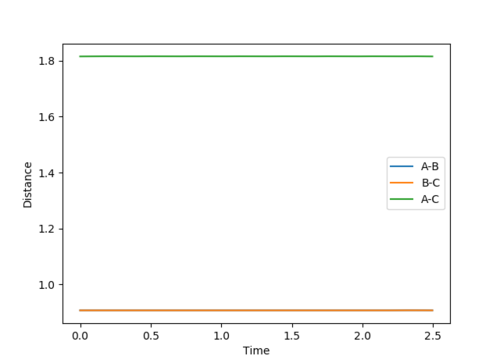
rts= 0.9076 In the figure 1, it is an Internuclear Distances vs Time plot, the curves of A-B, B-C and A-C are flat, indicating that there is no vibration. The lines of A-B and B-C are overlapped.
Good--Sw2711 (talk) 11:38, 21 May 2018 (BST)
Comment on how the mep and the trajectory you just calculated differ.
I think I need a bit more explanations than a few figures and a table. --Sw2711 (talk) 11:41, 21 May 2018 (BST)

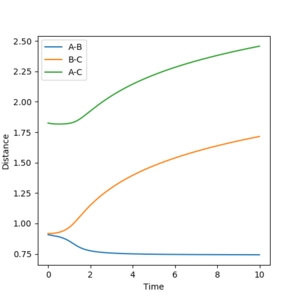
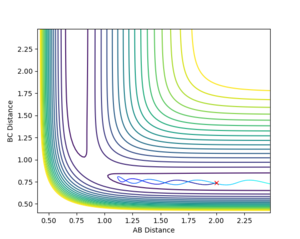
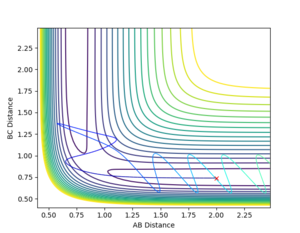
Figure 2 and 3 show the Internuclear Distances vs Time plot.
| Distance (trajectory) | Distance (MEP) | |
|---|---|---|
| A-B | 0.79 | 0.74 |
| B-C | 9.96 | 1.72 |
| A-C | 10.73 | 2.46 |


Figure 4 and 5 show the Internuclear Momenta vs Time plot.
| Average Momenta (trajectory) | Average Momenta (MEP) | |
|---|---|---|
| A-B | 1.24 | 0.00 |
| B-C | 2.76 | 0.00 |
| A-C | 1.86 | 0.00 |
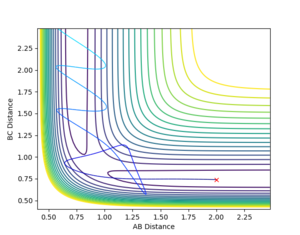
Complete the table by adding a column with the total energy, and another column reporting if the trajectory is reactive or unreactive. For each set of initial conditions, provide a plot of the trajectory and a small description for what happens along the trajectory.
Good--Sw2711 (talk) 11:41, 21 May 2018 (BST)
State what are the main assumptions of Transition State Theory. Given the results you have obtained, how will Transition State Theory predictions for reaction rate values compare with experimental values?
1. The reactants (or products) are in equilibrium with the activated complex.[1]
2. Quantum-tunneling effects are negligible and the Born-Oppenheimer approximation is invoked.[1]
3. Once the system attains the transition state, with a velocity towards the product configuration,
it will not reenter the initial state region again.[1]

Based on the Transition State Theory, there is no quantum-tunneling. However, according to quantum mechanics,
there is a possibility that particles can still tunnel across the barrier with a low activation energy,
which means that there is a chance that molecules will react by tunneling. Therefore, Transition State
Theory predictions for reaction rate values would be higher than the experimental values.[2]

Reference:
[1] Heterogeneous Catalysis, T. Bligaard, J.K. Nørskov, in Chemical Bonding at Surfaces and Interfaces, 2008
[2] Masel, R. (1996). Principles of Adsorption and Reactions on Solid Surfaces. New York: Wiley.
I think the term ‘equilibrium’ is not very applicable here. ‘equilibrium’ is mainly used in statistical thermodynamics. So like…thinking about a reaction A+B<=>C. Statistically speaking there is 80% molecules in this system reacts from the left to the right and 20% the other way around. (about obviously you should think about more like a Boltzmann distribution ). This reaction has reached an equilibrium. But in terms of your system, there are only 3 atoms. So, it is either one way or the other. So you need to think about what TST means to your system. Does TST predict your five tests above well? Why or why not?--Sw2711 (talk) 11:42, 21 May 2018 (BST)
Exercise 2
Classify the F + H2 and H + HF reactions according to their energetics (endothermic or exothermic). How does this relate to the bond strength of the chemical species involved?
F + H2 reaction is exothermic and H + HF reaction is endothermic. H-F bond energy is greater than H-H bond, so energy is released as H-F bond is formed, so it is an exothermic reaction, whereas the formation of H-H bond would be endothermic.
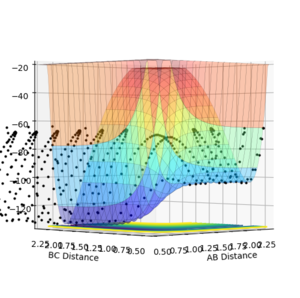
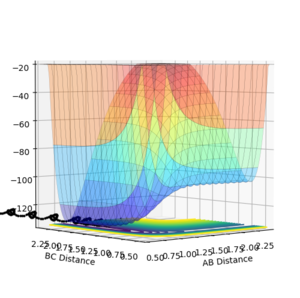
In the F+HH reaction, the products have a lower energy than reactants, so it is exothermic, whereas in H+HF reaction, it is the other way round.
This part is fair. --Sw2711 (talk) 11:59, 21 May 2018 (BST)
Locate the approximate position of the transition state.
The position of the transition state is: rFH=1.81, rHH=0.745. The position is determined by the graph below, the lines are flat, indicating that the vibration of the bonds are minimum.
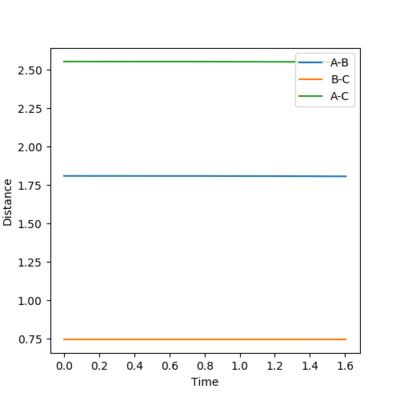
Fair. A better explanation could be 'no vibration' is expected at TS. The lines are flat ...etc--Sw2711 (talk) 11:59, 21 May 2018 (BST)
Report the activation energy for both reactions.
AE of F + H2 reaction = -103.752 -(-100.049)= -3.703
AE of H + HF reaction = -103.752 -(-126.517)= 22.765
I need some evidence and explanations in terms of how you obtained those numbers and what are you doing here. Any reasons behind it?--Sw2711 (talk) 11:59, 21 May 2018 (BST)
Identify a set of initial conditions that results in a reactive trajectory for the F + H2, and look at the “Animation” and “Internuclear Momenta vs Time”. In light of the fact that energy is conserved, discuss the mechanism of release of the reaction energy. How could this be confirmed experimentally?
| FH distance | 2.30 |
| HH distance | 0.74 |
| FH momentum | -2.70 |
| HH momentum | 0 |
| 1 | 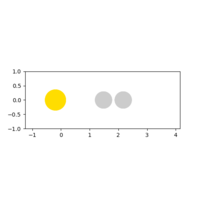 |
| 2 |  |
| 3 | 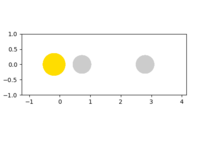 |
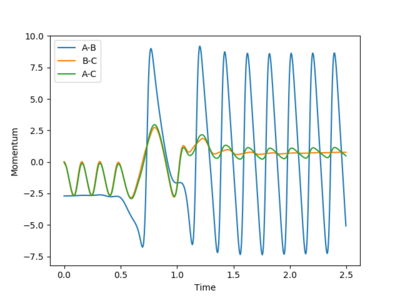
From the captures of animation, after the formation of the H-F bond, energy is released as it is an exothermic reaction, and this reaction energy is converted to kinetic energy of the H atom, which is moving away from the HF molecule and the H atom must collide with another atom and so on. Therefore, the kinetic energy is converted into thermal energy, so there should be an increase in temperature. This can be confirmed by measuring the temperature before and after the reaction.
Fair --Sw2711 (talk) 11:59, 21 May 2018 (BST)
Calculation starting on the side of the reactants of F + H2, at the bottom of the well rHH = 0.74, with a momentum pFH = -0.5, and explore several values of pHH in the range -3 to 3:
| pHH | Contour Plot | pHH | Contour Plot |
|---|---|---|---|
| -3 | 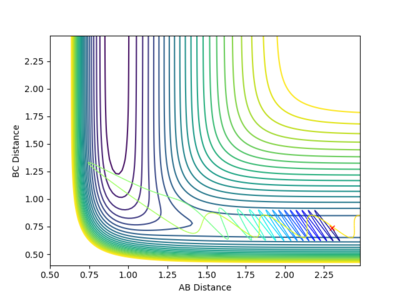 |
3 | 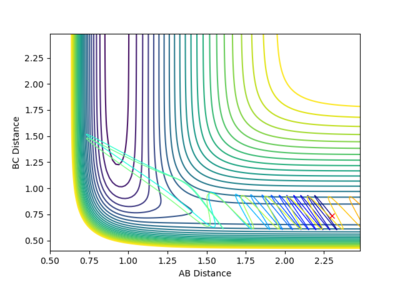 |
| -2 | 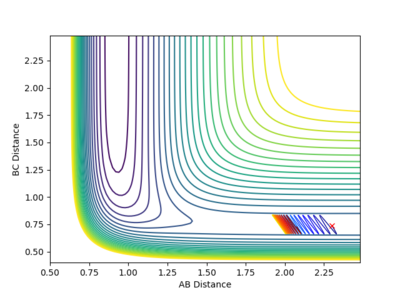 |
2 | 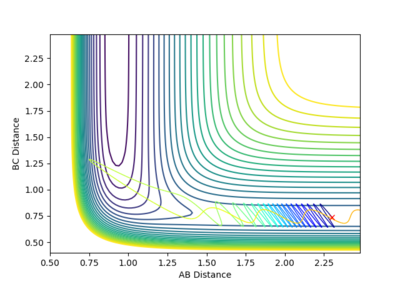 |
| -1 | 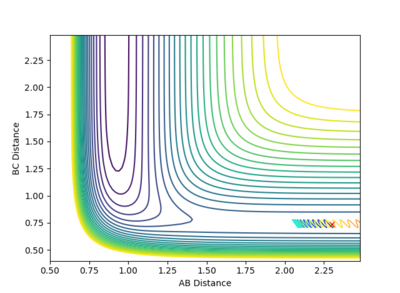 |
1 | 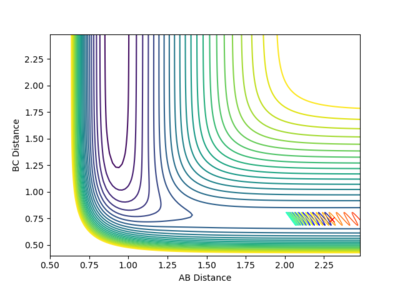 |
| 0 | 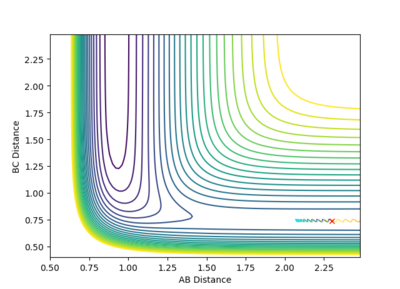 |
The energy put in is to high, the vibration of H-H bond is too great that it cannot form a bond with F atom. It is unreactive.
But you tested from low vibrational energy (0) to high vibrational energy (|3|), none of them is reactive. Why is that? --Sw2711 (talk) 11:59, 21 May 2018 (BST) |
For the same initial position, increase slightly the momentum pFH = -0.8 and reduce the momentum pHH = 0.1, the HH approaches the F atom gradually.
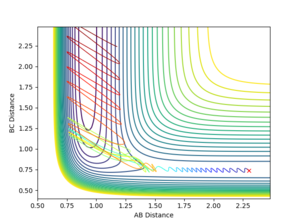
The reaction is reactive by increasing the steps to 1200.
The reverse reaction, H + HF
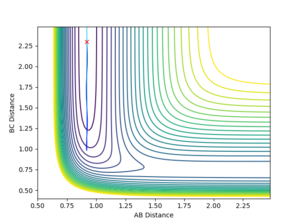
| FH distance | 0.92 |
| HH distance | 2.3 |
| FH momentum | -4.2 |
| HH momentum | -4.6 |
These conditions give a low vibrational motion on on the H-F bond, but with a high kinetic energy in H atom. However, this is an unreactive trajectory.
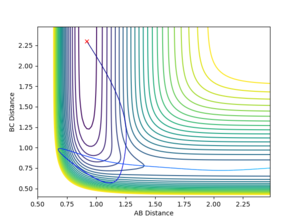
The table below shows the conditions where reactive trajectory is occurred.
| FH distance | 0.92 |
| HH distance | 2.3 |
| FH momentum | -2.0 |
| HH momentum | -10.9 |
Okay. You have compared another set. So what? --Sw2711 (talk) 11:59, 21 May 2018 (BST)
Discuss how the distribution of energy between different modes (translation and vibration) affect the efficiency of the reaction, and how this is influenced by the position of the transition state.
Both of the translation and vibration energies cannot be too high or too low for a reactive trajectory to occur.
It is good to see that you did some experiments yourself. But I'd like to see whether you have discovered any trend. It should be a bit more practical than 'Both of the translation and vibration energies cannot be too high or too low for a reactive trajectory to occur.' So if someone reads your reports, what is your recommendation to them about how to obtain a successful reaction? What would be the best way to make a reaction by changing the translational and vibrational energy for different types of reactions? --Sw2711 (talk) 11:59, 21 May 2018 (BST)

