MRD:jl7617
Questions: H + H2 system
Mathematical definition of transition state
The transition state in a reaction can be identified as a saddle point on the PES (potential energy surface) of a specific reaction. The mathematical way to identify saddle point is fr1fr2 < f2r1r2. A local minimum of the PES can be identified when fr1r1 > 0 and fr1r1fr2r2 > f2r1r2.
You need to define the vectors r1 and r2 on your PES: are they the rAB/rBC vectors?
Estimation of transition state position (rts)
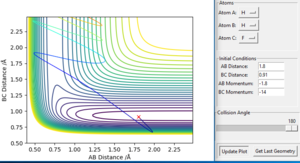
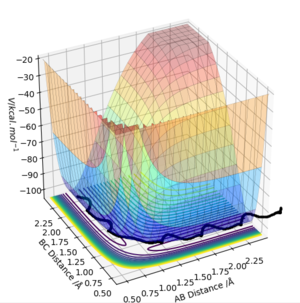
The best estimation of transition state position is rts=0.9078. To identify the rts, the initial condition was set at r1=r2 and p1=p2=0, as the transition state must have r1=r2. With the MEP calculation (MEP was used as it excludes the effects of kinetic energy, makes it easier to locate minimum potential energy point), a set of data contains the value of reaction coordinate and corresponding potential energy at each step was generated. A minimum potential energy with r1=r2 was identified among these data. With the precondition r1=r2 and minimum potential energy, this point can be regarded as a saddle point on PES, in other words, a transition state in reaction pathway. At this transition position, the coordinate rts=0.9078. To further confirm this point is a transition state point, a “Internuclear Distances vs Time” plot (figure 2.) was presented below. It can be seen in the graph that AB and BC decrease and approaches a constant value step by step. This means the molecules approach each to other in a specific trajectory and finally reaches the transition state where r1=r2= rts. The value of rts is approximately 0.908 according to observation on the plot.

A dynamics plot starting at the TS, with all momenta set to zero, would be a useful confirmation that you've obtained the correct TS geometry. If your geometry is correct, then none of the positions should change (i.e.: your internuclear distances vs time plot would be flat throughout your simulation)
Difference between MEP and Dynamics trajectory
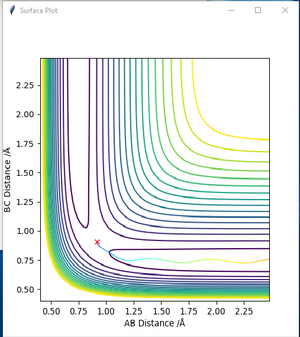
In order to compare the difference between MEP and Dynamics trajectory, an initial condition: r1=rts+0.01=0.918, r2=rts=0.908, p1=p2=0 was set. In this condition, the system deviates a little bit from the transition state. Two 'contour plots' generated from MEP and Dynamics respectively are presented below. (figure 3 and figure 4) By comparing the two plots, it can be seen that reaction proceeds with vibration in Dynamics trajectory while vibration cannot be seen in MEP. This implies energy is conserved in Dynamics trajectory. Vibration cannot be seen in MEP as velocity is always equal to zero in each time step in MEP. Therefore, energy is not conserved in MEP trajectory.
Good answer!
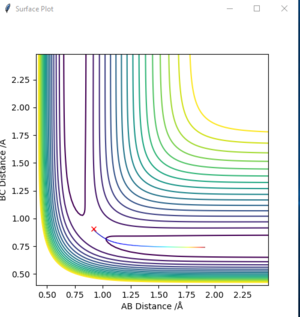
Two 'energy vs. time plots' by these two trajectories are also presented below. (figure 5 and figure 6) These two plots then prove the conservation of energy in Dynamics trajectory.


Reactive and nonreactive trajectory
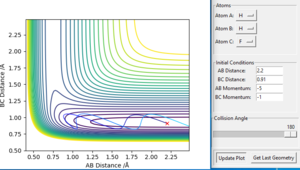
Based on the previous calculations, it is concluded that with initial conditions r1 = 0.74 r2 = 2.0, trajectories with momenta ranges from -1.5 < p1 < -0.8 and p2 = -2.5 are reactive. To test the reactivity of a reaction with higher value of momenta (in other words higher kinetic energy), trajectories with different momenta combination are ran. Results including reaction reactivity and total energy are organised in the table below. A contour plot for each specific condition is presented below, with corresponding descriptions of the dynamics.
Trajectories with different momenta combination
| Condition | p1 | p2 | Etot | Reactive? | Figure |
|---|---|---|---|---|---|
| 1 | -1.25 | -2.5 | -99.018 | Yes | 7 |
| 2 | -1.5 | -2.0 | -100.456 | No | 8 |
| 3 | -1.5 | -2.5 | -98.956 | Yes | 9 |
| 4 | -2.5 | -5.0 | -84.956 | No | 10 |
| 5 | -2.5 | -5.2 | -83.416 | Yes | 11 |
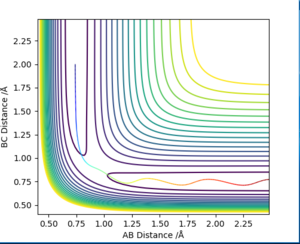
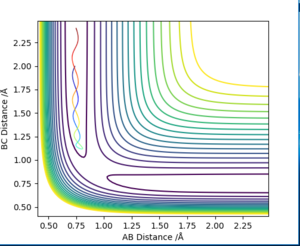
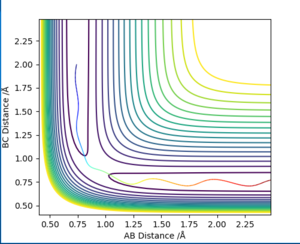
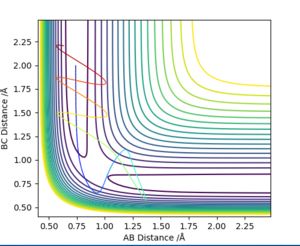
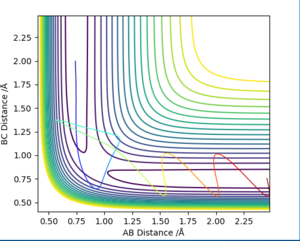
Compared conditions 1-3, it can be concluded that with the same initial condition, reactants with sufficient kinetic energy (initial momenta within the range presented above) will undergo successful chemical reaction. However from conditions 4 and 5, it is concluded that when the kinetic energy is far more than activation energy, a successful reaction cannot be guaranteed.
Assumptions and limitations of transition state
Transition State theories have made few assumptions: [1]
- ↑ Chemical Kinetics and Dynamics, second edition, Jeffrey I. Steinfeld, Joseph S. Francisco, William L. Hase
1. Born-Oppenheimer approximation: reactions of the a nuclei and electrons in a molecule could be separated.
2. Reactant molecules are distributed according to Maxwell-Boltzmann distribution.
3. When the system reaches and crosses the transition state, it cannot turn back into reactants.
4. In a transition state, motion along the reaction coordinate could be separated from other types of motions and be treated classically as translation motion.
5. Even the reactants and products are not in equilibrium, the transition states that tend to form products are still distributed according to Maxwell-Boltzmann distribution.
The reaction rate values predicted by Transition State theory is larger than experimental values. In reality, product reform happens. The reaction will proceed slower than TS theory predicts.
Ng611 (talk) 23:27, 11 May 2019 (BST) Good answer and god first section, well done!
Questions: F-H-H system
Enthalpy of reaction by PES inspection
To investigate F-H-H system, atom A is set as F and atoms BC are set as H in GUI. Initial condition is set as 'AB=2.2 Å, BC=0.74 Å, AB momentum=-1.7, BC momentum=-1.8'. This describes the F + H2 reaction with certain initial momenta. The corresponding potential energy surface diagram is presented below. (Figure 12.)
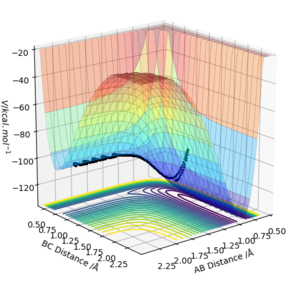
When we look at the reaction coordinates on PES: As BC distance is around 0.74 Å (the bond length of H2) and AB distance is larger than 0.91 Å (the bond length of HF), this part of the diagram corresponds to the F + H2 system. On the contrary, as AB distance is around 0.91 Å (the bond length of HF) and BC distance is larger than 0.74 Å (the bond length of H2), this part of the diagram refers to the H + HF system. Overall, it can be seen that potential energy decreases from F + H2 system to H + HF system. Since the reaction is reversible, it is concluded that F + H2 reaction is exothermic and H + HF reaction is endothermic.
The exothermic F + H2 reaction shows that product HF bond strength is larger that reactant H2 bond. Since bond formation releases energy, the system releases energy and forms a stronger bond.
The position of Transition State
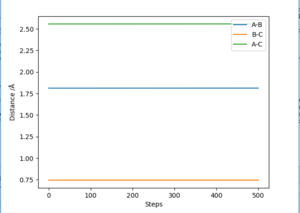
According to Hammond postulate, the structure of the transition state will be similar to reactants or products, to whichever is closer in energy. Based on the previous discussion, it is known that the F + H2 reaction is exothermic. Therefore, in the F + H2 reaction, the transition state's structure resembles that of reactants. This implies AB distance is larger than BC distance in transition state. To locate the position of transition state, initial momenta are set equal to zero with AB distance larger than BC distance. An optimised transition state in contour map should be a 'red cross' without any reaction pathway to either reactants or products. Different set of AB and BC distances values were tried in GUI. A best estimate point was found at AB= 1.8120 Å, BC= 0.7446 Å. The corresponding 'contour plot' is presented as Figure 13. An 'Internuclear distance vs. time' plot was also presented as Figure 14. It can be seen from Figure 14 that at this point AB and BC distance tends to be constant as time increases, which confirms this point is a transition state point.

Activation energies of both reactions
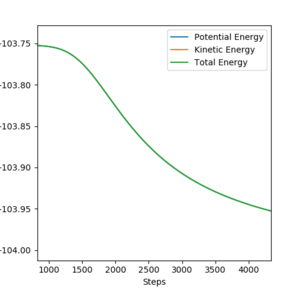
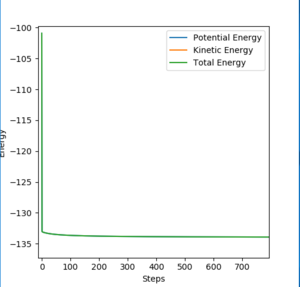
By changing the initial condition to BC= 0.744 Å while maintaining other conditions the same, we now have a structure neighbouring to transition state. As the BC distance here was smaller than that in transition state, the reaction will tend to fall to reactants F and H2. Therefore, in this condition the change in total energy corresponds to the activation energy of F + H2 reaction. A zoom in picture of total energy change is presented in Figure 15. Same method was used to calculate activation energy of H+ HF reaction. A zoom in picture of total energy change in H+ HF reaction is presented in Figure 16.
Based on values read from total energy change graphs, activation energies of both reactions were calculated.
Overall:
Activation energy of F + H2 reaction equals to +0.201 kcal/mol.
Activation energy of H + HF reaction equals to +30.11 kcal/mol.
Ng611 (talk) 23:29, 11 May 2019 (BST) Good calculations!
Reaction dynamics of F + H2 reaction
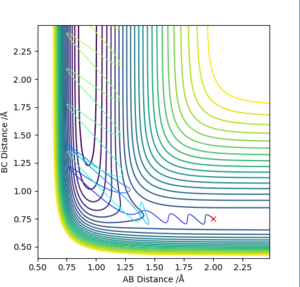
In order to investigate the reaction dynamics of F + H2 reaction, several initial conditions were tried to find a reactive trajectory for F + H2 reaction. A set of initial condition that works is AB = 2.0 Å, BC = 0.75 Å, AB momentum= -1.7, BC momentum = 0. A reaction pathway was shown on the contour plot presented below. (Figure 17.)
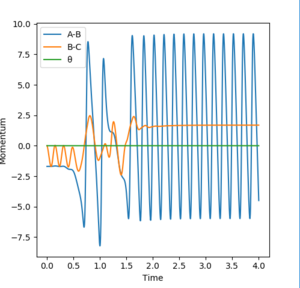
Under this initial condition, a 'momenta vs. time' plot was also produced. (Figure 18.) From this graph, it can be seen that momenta of BC tends to be constant after the reaction taken place. At the same time, AB maintains a large momenta, this implies that AB has a large kinetic energy after the reaction happens.
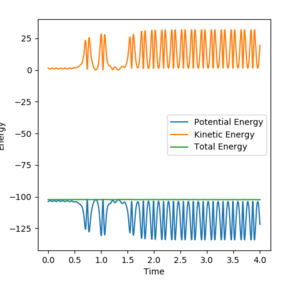
In order to investigate the mechanism of release of the reaction energy, a 'Energy vs. Time' plot was also produced in Figure 19. Total energy is conserved in this reaction. After the reaction takes place, kinetic energy and potential energies are exchanging with each other. Overall, the kinetic energy is larger than initial condition while potential energy is smaller. This means after the reaction molecules have larger kinetic energy. This can be detected experimentally as an increase in temperature of the reaction system.
Ng611 (talk) 23:31, 11 May 2019 (BST) An increase in energy tells you that there is more kinetic energy, but doesn't tell you how this extra KE is distributed across vibrations/translations. How would you design an experiment to check this?
Polanyi's empirical rules
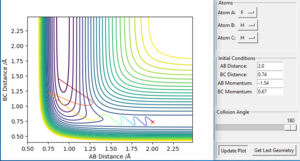
Polanyi's empirical rules states that the location of 'energy barrier' is very important in determining the reactive trajectory for a reaction. An exothermic reaction tends to have an early energy barrier that appears in the entrance channel where reactants approach each other; on the contrary, an endothermic reaction tends to have a late energy barrier that appears in the exist channel where products move away from each other.
In an exothermic reaction, to overcome the early energy barrier, translational energy of the reactants plays a more important role than rotational energy to make a reaction take place successfully. However, in an endothermic reaction, the vibrational energy in the reactants are more effective than translational energy to cross the late energy barrier. [1]
- ↑ Chemical Kinetics and Dynamics, second edition, Jeffrey I. Steinfeld, Joseph S. Francisco, William L. Hase
Polanyi's empirical rules are then applied to one endothermic and one exothermic system, in order to explain the theories above.
Exothermic reaction: F + H2

Endothermic reaction: H + HF
