MRD:jjb215
H+H2 system
Stationary points on the potential energy surface
The value of the total gradient of the potential energy surface (PES) is zero at a minimum and at a transition state (a saddle point). This is indicated by the stationary points of the PES, where the stationary points can be determined as points where both partial derivatives ∂V/∂r1 (fx) and ∂V/∂r2 (fy) are equal to zero. The stationary points found can be distinguished as being either a minimum or a transition state by using the second partial derivatives to assess the curvature of the PES. To identify a minimum point, ∂2V/∂r12 (fxx) and ∂2V/∂r22 (fyy) should both be greater than zero. For a transition state (a saddle point), the result of fxxfyy - fxy2 should be less than zero.
The minimum point is a point at which any movement in any direction causes an increase in energy. On the contrary, a transition state is a point at which movement along the minimum-energy path causes a decrease in the energy; whilst, movement orthogonal to the minimum-energy path will cause an increase in the energy.
Locating the transition state position, rts
 |
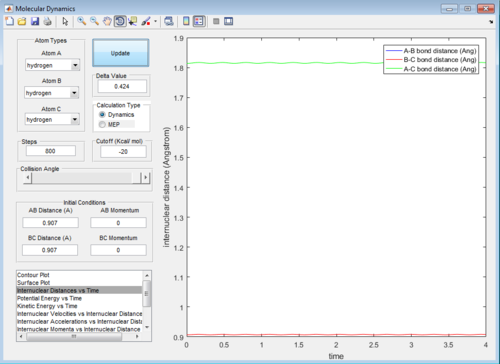 |
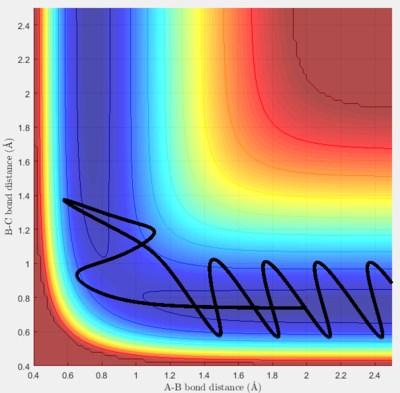
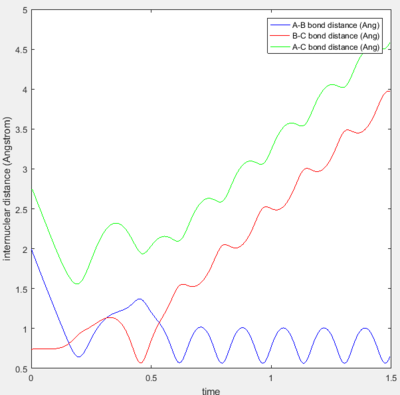
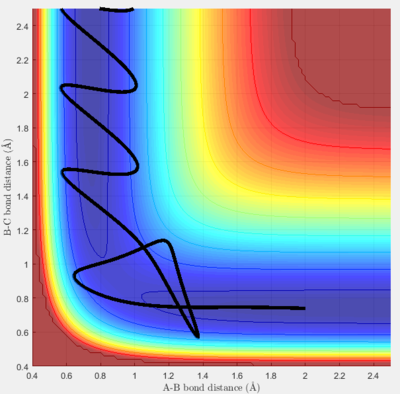
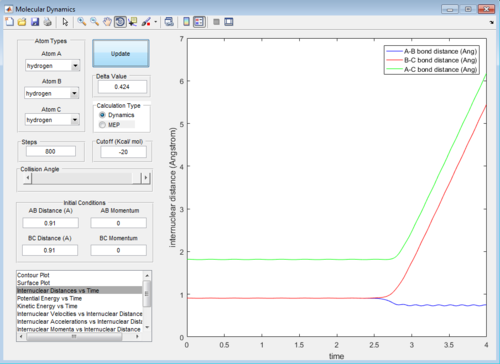
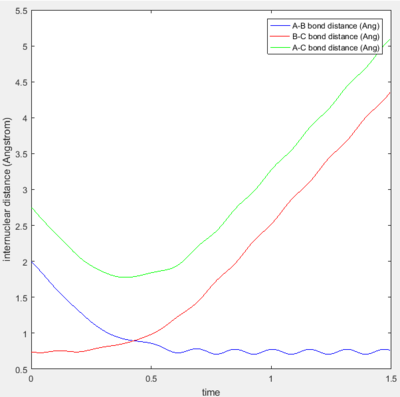
The best estimate for the transition state position is 0.907 Å. Using Figure 1a, it can be seen that the B-C internuclear distance starts to increases after 800 steps of calculation-- showing that the trajectory starts to fall off to the products. The best estimate is shown in Figure 1b, it can be seen that the trajectory continues to oscillate on the saddle point without any increase in either A-B or B-C internuclear distances- showing that the trajectory never falls off either to the reactants or products after 800 steps.
Difference between Dynamics and MEP trajectories
 |
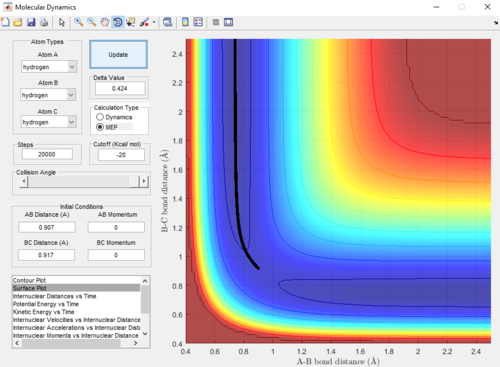 |
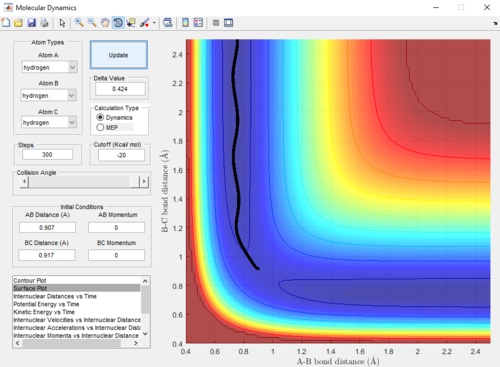
Dynamics and MEP differ in that the trajectory obtained from dynamics is oscillating-- indicating a vibration in the A-B bond formed, whereas the trajectory from MEP is linear-- indicating no vibration. This difference is due to the Dynamics calculations taking into account the velocities of the atoms in each step. This means that even after reaching the equilibrium A-B bond length, the calculation in the subsequent step carries on to use the velocities from the previous step-- causing a vibration in the A-B bond as the B-C internuclear distance increases. On the other hand, MEP does not take into account velocities in its calculations (the velocity is reset to zero in each step); therefore, after the equilibrium A-B bond length is reached, there is no driving force to cause the bond to vibrate.
An advantage of MEP is that it gives a more precise trajectory due to no oscillation; however, the Dynamics trajectory provides a more realistic representation of the motion of the atoms during the reaction.
Reactive and unreactive trajectories
| Trajectory | p1 | p2 | Reactivity |
|---|---|---|---|
| 1 | -1.25 | -2.5 | reactive |
| 2 | -1.5 | -2.0 | unreactive |
| 3 | -1.5 | -2.5 | reactive |
| 4 | -2.5 | -5.0 | unreactive |
| 5 | -2.5 | -5.2 | reactive |
 |
 |
 |
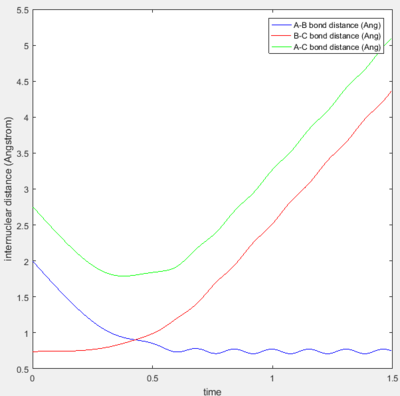
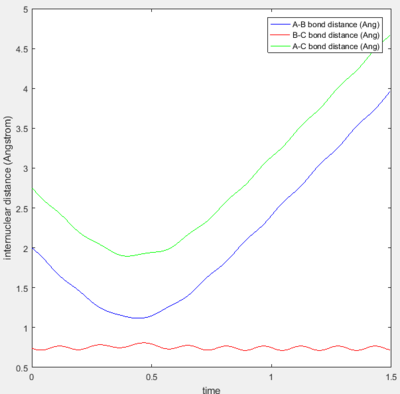
Trajectories 1 and 3 are similar in that they are both reactive and show no barrier recrossing. Figures 3a and 3c shows the collision of the incoming H atom with the H2 diatomic-- as indicated by the decrease in the A-B bond distance. After the reaction, the A-B bond distance is shown to oscillate within a constant range of internuclear distance-- this indicates bond vibration and hence, the formation of a new H-H bond. At the same time, there is an increase in the B-C bond distance after the reaction-- showing the other H atom leaving.
Trajectory 2 is unreactive, Figure 3b shows the short decrease and then a larger increase in the A-B bond distance-- this indicates that the incoming H atom approaches the H2 diatomic but does not get close enough to form a transition state.
Trajectory 4 is unreactive with barrier recrossing. As seen from Figure 3d, the decrease in the A-B distance shows that the incoming H atom approaches the diatomic close enough that a new bond forms and starts to oscillate slightly. However, the A-B bond experiences a large increase-- showing that the new bond breaks shortly after being formed. Figure 3e explicitly shows the trajectory passing through the transition state region and then recrossing the barrier back to the reactants.
Trajectory 5 is reactive but also consists of barrier recrossing. Figure 3f shows an initial decrease in the A-B bond distance and then a small elongation, before finally forming a stable H-H bond as indicated by the oscillation of the A-B bond distance. The increase in the B-C bond distance is also shown, which indicates the other H atom leaving. Figure 3g shows that the trajectory crosses the transition state region three times before finally reaching the products side.
Transition State Theory
An assumption of the Transition State Theory (TST) is that all supermolecules from the reactants side (H3 in this case) that cross the critical dividing surface will become products. The critical dividing surface is defined as a boundary surface that starts at the origin, crossing through the transition state (saddle point) and extends to the opposite side. Another assumption is that the Boltzmann distribution of energy is maintained for the reactants during the reaction. The third assumption is that the supermolecules that cross the critical dividing surface from the reactant side have a Boltzmann distribution of energy that correspond to the temperature of the reacting system.[1] TST would predict reaction rates that are higher than experimental values. As can be seen from trajectory 5, the critical dividing surface has been crossed once at the start but does not immediately reach the products side; however, this is not the case with TST as a result of the first assumption.
F-H-H system
Inspection of the F-H-H stystem PES
The PES of the F-H-H system shows the potential energy of the reactants (F+H2) and products side (H+HF). The potential energy is -434.7 kJ/mol for F+H2 and -560.2 kJ/mol for H+HF and this shows that the F+H2 reaction is exothermic due to a ΔE value of -125.5 kJ/mol. On the other hand, the H+HF reaction is endothermic due to a ΔE value of +125.5 kJ/mol. The energetics of these two reactions means that the H2 bond is weaker than the HF bond because energy is released overall after breaking the H2 bond and forming a new HF bond. The magnitude of the ΔE value is consistent with the value obtained computationally by C. F. Bender et al., which is 143.9 kJ/mol.[2]
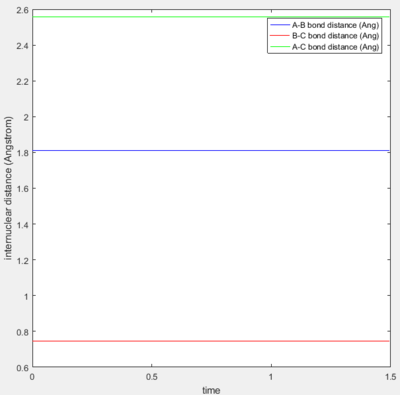
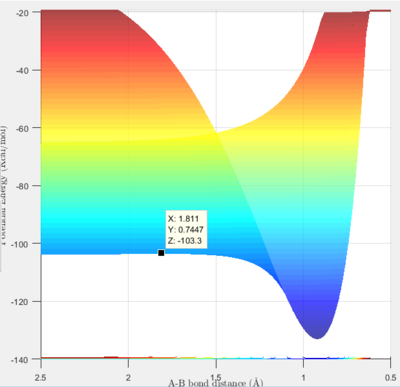
The approximate transition state was found to be at r1 (H-H distance)=0.745 Å and r2 (H-F distance)= 1.811 Å, by using a trial and improvement approach. Figure 5 shows that after 300 steps of calculation, the trajectory just continues to oscillate on the saddle point without rolling to either the reactants or the products.
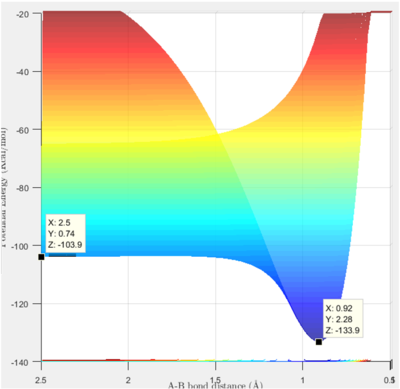
The energy of the approximate transition state, F-H-H, was found to be -432.2 kJ/mol, as shown by Figure 6. In the forward reaction, the energy of the reactants (F+H2) is -434.7 kJ/mol and the activation energy is 2.5 kJ/mol. Whereas, in the H+HF reaction, the reactants have an energy of -560.2 kJ/mol and therefore, the reaction has an activation energy of 128.0 kJ/mol.
Reaction dynamics
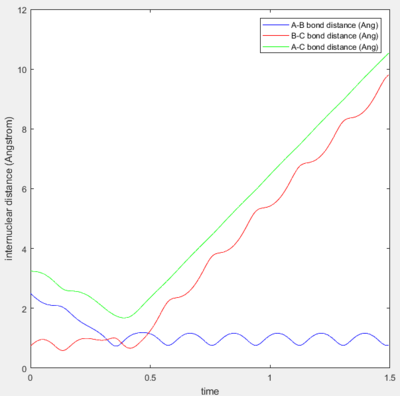 |
After setting initial conditions for a reactive pathway for the F+H2 reaction, the reaction energy is released as vibrational and translational energy. This can be seen from Figure 7, showing that the H-F internuclear distance starts to oscillate-- indicating that the H-F bond is vibrating after being formed. The reaction energy is also released as translational energy as the leaving H atom and HF diatomic separate, which can be seen in Figure 7 as a steep line with a constant gradient-- indicating a constant translational energy. The mechanism of the release of reaction energy can be determined experimentally by using calorimetry.
Polanyi's rules state that the contribution from vibrational energy is more efficient in promoting a reaction with a late transition state; whereas, the translational energy is more efficient at promoting reactions with an early transition state.[3] Hammond's postulate can be used to determine whether the reactions involved in this system have an early or late transition state. In Figure 6, it can be seen that the F+H2 reaction is exothermic and has an early transition state-- indicating that the reaction will be more efficient if the translational energy of the incoming atom (F atom) is higher. Conversely, the reaction H+HF is endothermic and has a late transition state and therefore, this reaction would be more efficient if the vibrational energy of the diatomic (HF) is higher.
References
- ↑ I. N. Levine, Physical chemistry, McGraw-Hill, New York ; London, 4th ed. edn., 1995.
- ↑ C. F. Bender, S. V. O'Neil, P. K. Pearson and H. F. Schaefer, Science, 1972, 176, 1412-1414.
- ↑ Z. Zhang, Y. Zhou, D. H. Zhang, G. Czakó and J. M. Bowman, The Journal of Physical Chemistry Letters, 2012, 3, 3416-3419.


