MRD:jh6415
This report investigates the molecular reaction dynamics of two triatomic systems: the H + H2 system and the F - H - H system. This report provides answers to the questions posed in the script.
Exercise 1: H + H2 System
Question 1
What value does the total gradient of the potential energy surface have at a minimum and at a transition structure? Briefly explain how minima and transition structures can be distinguished using the curvature of the potential energy surface.
The first derivative of the potential energy with respect to the position corresponds to the gradient of the potential energy surface. At a minimum and at a transition state structure (which corresponds to the highest energy point, the maximum, on the minimum energy pathway), this derivative takes a value of 0. The second derivative of potential energy with respect to position corresponds to the curvature of the potential energy surface. A positive value corresponds to a minimum and a negative value corresponds to a maximum (the transition state structure).
(Fv611 (talk) 10:34, 30 May 2017 (BST) Correct, but as you note even the TS is on the minimum energy pathway. What will be the value of its second derivative in directions that are not that of the reaction coordinate?)
Question 2
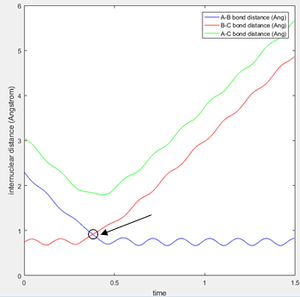
Report your best estimate of the transition state position (rts) and explain your reasoning illustrating it with a “Internuclear Distances vs Time” screenshot for a relevant trajectory.
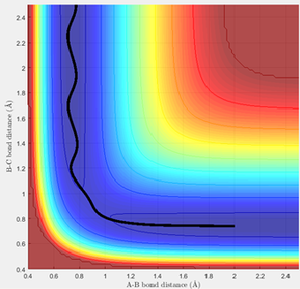
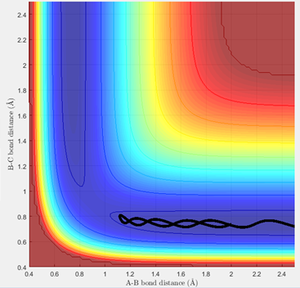
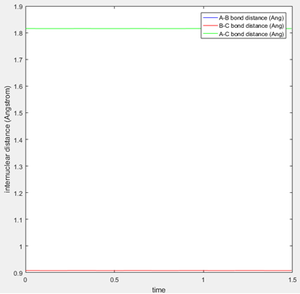
An estimate for the transition state position was made from an estimate of the point where the AB and BC bond distances crossed on the "Internuclear Distances vs Time" graph (figure 1), and then adjusting this value to obtain a constant and equal AB/BC distance, corresponding to zero gradient. The best estimate of the transition state position is 0.9078 Å. This internuclear distance corresponds to the saddle point, where there are no/very little vibrations about the equilibrium structure and internuclear distance becomes constant, as shown in figure 2.
Question 3
Comment on how the mep and the trajectory you just calculated differ.
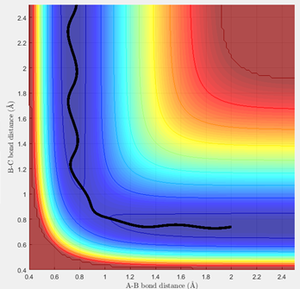
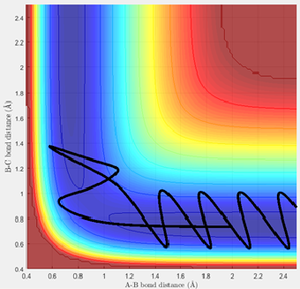
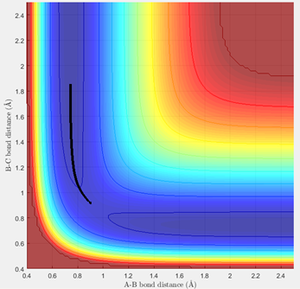
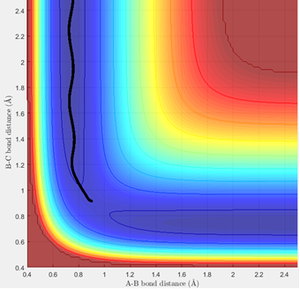
The trajectory for the mep can be observed to be a non-wavy line (figure 3), whereas the calculated dynamics trajectory is wavy (figure 4). Therefore, the mep trajectory corresponds to a pathway without molecular vibrations, so is always along the lowest energy pathway and hence needs more steps to fully extend the trajectory. On the other hand, the calculated dynamics trajectory includes vibrational motion.
(Fv611 (talk) 10:34, 30 May 2017 (BST) You are describing the effects and not the cause. Why doesn't the mep include vibrational energy? It has to do with its treatment of velocities)
Question 4
Complete the table by adding a column reporting if the trajectory is reactive or unreactive. For each set of initial conditions, provide a screenshot of the trajectory and a small description for what happens along the trajectory.
(Fv611 (talk) 10:34, 30 May 2017 (BST) Correct, but there could be more discussion: what is the difference between reaction 1 and reaction 3?)
Question 5
State what are the main assumptions of Transition State Theory. Given the results you have obtained, how will Transition State Theory predictions for reaction rate values compare with experimental values?
Transition State Theory assumes that if reactant molecules pass through the critical dividing surface (the transitional state region), then the reaction will form products. Additionally, it assumes that as the reaction progresses, the molecules of reactant have a Boltzmann distribution of energy and that supermolecules which pass through the critical dividing surface also have Boltzmann distributed energies dependent on the reaction temperature. Finally, it is assumed that movement along the reaction pathway is classical.1 Therefore, Transition State Theory does not include quantum mechanical tunnelling through the potential energy barrier, whereby lighter molecules with insufficient kinetic energy to cross the energy barrier may still form product molecules, hence these reactions would have higher experimental rate constant than predicted by TST, as a reaction can still occur. TST does not account for recrossing of the transition state region, so it's likely that experimental rate constants for these reactions would also differ from predicted values.
Exercise 2: F - H - H System
Question 1
Classify the F + H2 and H + HF reactions according to their energetics (endothermic or exothermic). How does this relate to the bond strength of the chemical species involved?
F + H2 is an exothermic reaction as the products are at a lower energy than the reactants. H + HF is endothermic as products are at a higher energy than the reactants. The H-F bond is stronger than the H-H bond, hence for F + H2, more energy is released upon forming the H-F bond than is taken in upon breaking the H-H bond, giving an overall exothermic process. For H + HF, more energy is absorbed to break the H-F bond than is released to form the new H-H bond, giving an overall endothermic process.
Question 2
Locate the approximate position of the transition state.
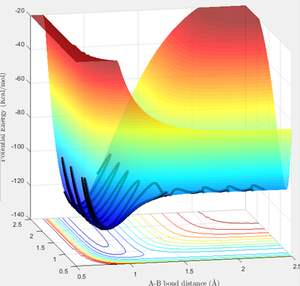
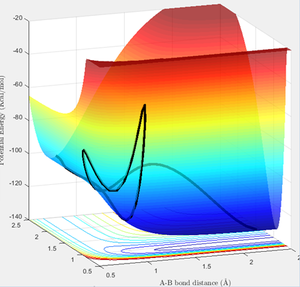
Hammond's Postulate states that for an exothermic reaction, the transition state occurs early and lies closer to the reactants, hence the transition state resembles the reactants. Hammond's Postulate was therefore used to estimate the position of the transition state for F + H2 (and hence H + HF as this reaction has the same transition state), and then the bond lengths were adjusted to give constant values in the "Internuclear Distances vs Time" graph as before (figure 7). The located transition state on the PE surfaces is also shown (figures 8, 9).
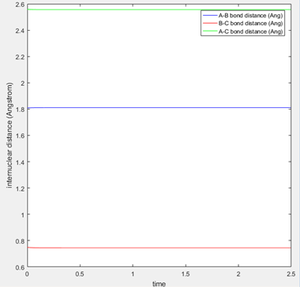
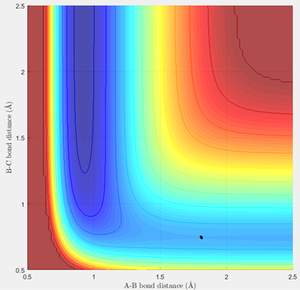

The transition state has H-H = 0.749 Å and H-F = 1.809 Å.
Question 3
Report the activation energy for both reactions.
Activation Energy of F + H2 :
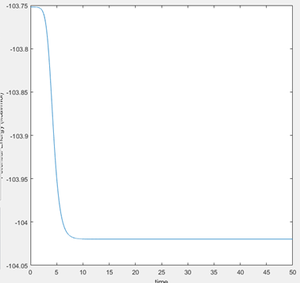
To find the activation energy, the energy of the transition state was first found to be -103.752 Kcal/mol. A mep calculation was carried out and the bond lengths were sequentially slightly displaced towards the reactants to extend the mep trajectory towards the reactants, to find the minimum energy of the reactants. The following potential energy vs time plot was hence produced (figure 10).
Energy of Transition State - Energy of Reactants = Activation Energy
-103.752 - (-104.020) = 0.268 Kcal/mol
Activation Energy of H + HF :
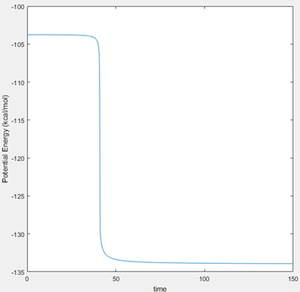
The activation energy of H + HF was found by exercising the same method as above.
Energy of Transition State - Energy of Reactants = Activation Energy
-103.752 - (-133.922) = 30.170 Kcal/mol
Question 4
In light of the fact that energy is conserved, discuss the mechanism of release of the reaction energy. How could this be confirmed experimentally?
There's conversion between potential, translational kinetic and vibrational energy in the reaction. The approaching fluorine atom possesses high kinetic energy which is converted to potential energy as the reacting particles come closer together due to increased repulsion. When the collision occurs, the potential energy will reach a maximum and kinetic energy will reach a minimum as the transition state is formed. Potential energy then decreases upon HF product formation and is converted to translational kinetic energy (in the unbonded H atom which is moving away) and vibrational energy (in the new HF molecule) in the products. This could be confirmed experimentally by investigating the formation of the vibrationally excited HF molecules. Since potential energy has been converted to vibrational energy, the HF molecules are in a vibrational excited state, which can be confirmed with infrared chemiluminescence.2
(Fv611 (talk) 10:34, 30 May 2017 (BST) Why are you not showing or referencing any graphs to support your argument?)
Question 5
Discuss how the distribution of energy between different modes (translation and vibration) affect the efficiency of the reaction, and how this is influenced by the position of the transition state.
For an attractive potential energy surface, the transition state occurs early and has a more efficient reaction when more energy is distributed in translational modes. The products produced after this early transition state are vibrationally excited. On the contrary, for a repulsive surface, the transition state occurs late and has a more efficient reaction when excess energy is distributed in the vibrational modes. The product produced will be present in an unexcited vibrational state.3
(Fv611 (talk) 10:34, 30 May 2017 (BST) You are providing zero justifications for your argument. Why should I believe it?)
References
1. I. N. Levine, Physical Chemistry, McGraw-Hill, New York, 6th edn., 2009, ch. 22, pp. 880-898.
2. W. E. Jones, G. Matinopoulos, J. S. Wasso, J. Chem. Soc., Faraday Trans. 2, 1978, 74, 2128-2137.
3. P. Atkins, J, de Paula, Atkins’ Physical Chemistry, Oxford Univesity Press, Oxford, 10th edn., 2012, ch. 21, pp. 911.

