MRD:jh5413
Molecular Reaction Dynamics
Introduction
The relative positions between the atoms give rise to differing inter-atomic interactions which can be represented on a Potential Energy Surface (PES). A PES graphically represents the potential energy of a system as a function of the inter-atomic separations. More straightforward chemical reactions can be approximated to obey classical mechanics (Newton's Equations of Motion). Although classical mechanics does not account for quantum effects, it remains a convenient approximation allowing calculations to be performed. By solving the Equations of Motion, the trajectory (relative positions of the atoms as a function of time) of the system can be determined and plotted on the PES.
(Great introduction Tam10 (talk) 10:14, 7 June 2017 (BST))
Part 1: The H + H2 System:
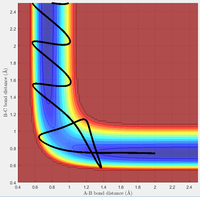
In Part 1, the reaction dynamics for the H + H2 reaction were studied. Figure 1 is a schematic of the reaction, depicting a hydrogen atom colliding with the diatomic hydrogen molecule.

Potential Energy Surface
At the minimum and at the transition state, the gradient of the potential energy surface is zero. While the minimum corresponds the the minimum of the MEP, the transition state is the maximum of the MEP and is defined as a saddle point. The gradient at both of these point is zero, however, they can be distinguished by inspecting the second derivative of each function. The second derivative at the minimum will yield a positive value. At the transition state, the second derivative will equal zero as, although it occurs at the maximum of the MEP, the transition state is a point of inflexion along the overall Potential Energy Surface.
(Not quite. Along R_AB and R_BC it might happen to be an inflection point. However, across the reaction coordinate (shown with the MEP) it has a negative second derivative, and orthogonal to this is a positive SD (minimum). For any TS of any system, there will always be one negative SD along the reaction coordinate and every other coordinate will have a positive SD. Tam10 (talk) 10:14, 7 June 2017 (BST))
Transition State Position
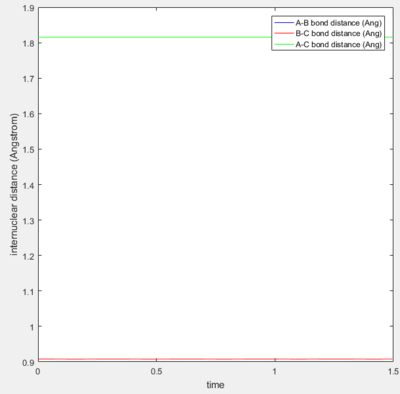
Due to the symmetrical nature of the H + H2 system, the transition state can be located at the point on the potential energy surface where the r1 = r2 = rts. This distance was approximated to 0.908 Å, as shown in Figure 2. Figure 2 is a plot of the inter-nuclear distance as a function of time and shows that rts remains constant (0.908 Å) with time at the transition state when the momentum of each atom is zero.
MEP and Dynamic Calculations
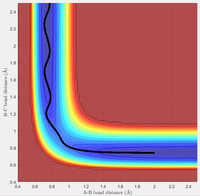
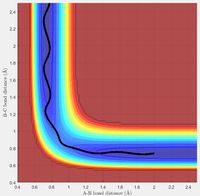
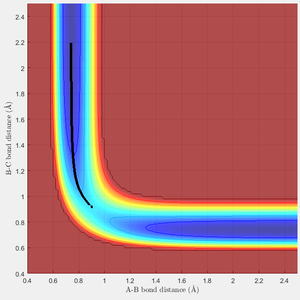
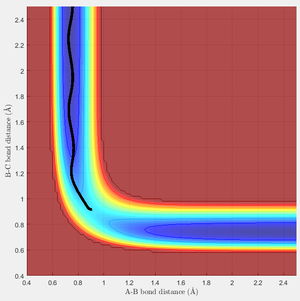
The MEP calculation produces the Potential Energy Surface shown in Figure 3. The MEP exactly follows the minimum energy and does not account for the actual motion of the atoms. The dynamic PES (Figure 4) accounts for the a more realistic picture of the vibrating atoms, resulting in a pathway that deviates from the minimum of the surface.
Reactive and Unreactive Trajectories
Not all initial conditions result in reactive trajectories. There are many factors, such as the translational/vibrational energies and atom positions, which determine whether a trajectory will be reactive. This fact is highlighted in the table below which shows a range of initial conditions for the H + H2 system and whether or not the trajectory was reactive. From the results, it can be seen that small changes in either translational or vibrational energy have a large impact on the reactivity of the trajectory. For example, when comparing Case D and E, the slight increase in translational energy is the difference between an unreactive trajectory in D and a reactive trajectory in E.
(You need a bit more text here to explain some of the differences in the first 3 trajectories Tam10 (talk) 10:14, 7 June 2017 (BST))
Transition State Theory
Transition State Theory is based on the assumption that atoms and molecules obey classical mechanics. Therefore, Transition State Theory will only predict a reaction to occur if atoms collide with enough energy to form the transition state. However, in quantum mechanics, there are alternative mechanisms for crossing the energy barrier between the reactants and products. Phenomena such as tunnelling is an example of how reactions may still occur even if the collision does not result in the formation of the transition state[1].
Therefore, in reality, there is a higher probability that a collision will result in a reaction which acts to increase the overall rate. When comparing predicted rates to experimental rates, the predicted rates will be slower than the experimental rates.
(What does TST say about recrossing? Tam10 (talk) 10:14, 7 June 2017 (BST))
Part 2: F-H-H System
Potential Energy Surface
Energetics
F + H2
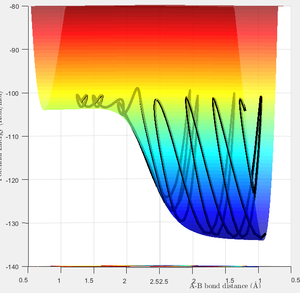
Figure 5 shows the reaction profile of the F + H2 reaction. From the plot, the reaction is clearly exothermic, as the products have a lower energy than the reactants. Energy is released during the formation of the F-H bond (565 kJ/mol)[2]. The F-H bond is far more favourable than the weaker H-H bond (432 kJ/mol)[2].
H + HF
The H + HF reaction has a high activation energy and is endothermic. This is because a large amount of energy is required to break the strong H-F bond, and little is gained in the formation of a new H-H bond.

Transition State Position
Hammond's Postulate states that the transition state of a reaction will resemble either the reactants of the products. For an exothermic, an early transition state resembling the reactants is expected, which agrees with the approximate position found at rH-H = 1.81 Å and rH-F = 0.75 Å.
Similarly, a late transition state resembling the products is expected for the endothermic reaction. The approximate position of the transition state was found where rH-H = 0.75 Å and rH-F = 1.81 Å.
Activation Energies
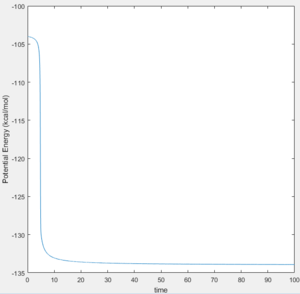
The activation energy for the reactions can be found by calculating the minimum energy of the reactants and the energy of the transition state (maximum along the MEP). The difference between these two values corresponds to the activation energy. MEP calculations were used to ensure the accurate energies were found. The result is the energies of the required states can be found from plots of Potential Energy Vs Time. For the endothermic reaction of H + HF, the Potential Energy Vs Time plots which were used to calculate the activation energy are shown in Figure 7 & 8:
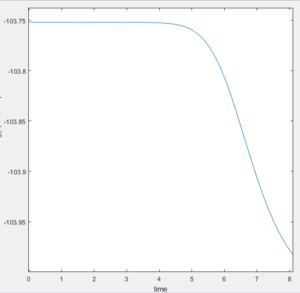
The activation energy of the F + H2 reaction: (-103.75)-(-104.02) = 0.27 kcal/mol
(This doesn't match what you have above... and you have the reactions the wrong way around. Tam10 (talk) 10:14, 7 June 2017 (BST))
The activation energy of the H + HF reaction: (-103.75)-(-133.92) = 30.17 kcal/mol
Reaction Dynamics
Release of Reaction Energy
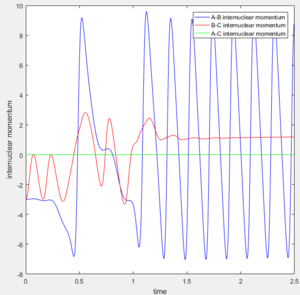
For a F + H2 reaction, initial conditions (Figure 9) result in a reactive trajectory. The corresponding Internuclear Momenta Vs Time plot (Figure 10) shows that initially there is low vibrational energy. As the reaction proceeds and the F-H bond is formed, energy is released via an increase in vibrational energy. This shows that the reaction energy is converted from potential energy into kinetic energy as the reaction proceeds.
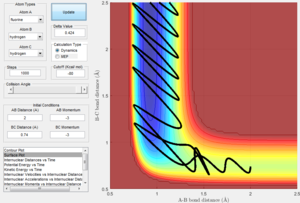
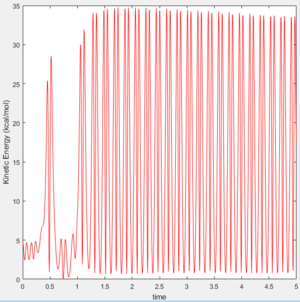
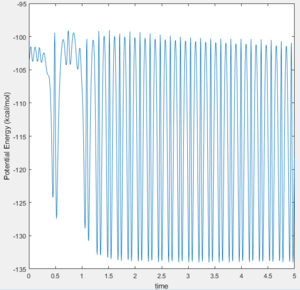
Since energy must be conserved, the increase in kinetic energy (vibrations) must match the loss in potential energy. The Kinetic Energy Vs Time graph (Figure 11) shows a large positive increase in kinetic energy as the reaction proceeds. This is because the vibrational energy of the product is much greater than that of the reactants. It follows, therefore, that the Potential Energy Vs Time graph (Figure 12) shows the opposite decrease in potential energy as the reaction proceeds.
(What about experimental confirmation of this? Tam10 (talk) 10:14, 7 June 2017 (BST))
Translational and Vibrational Modes
Polanyi's Empirical Rule states that vibrational energy is more efficient at promoting reactions with a late transition state (endothermic reactions), than translational energy. The reverse rules also apply, stating translational energy is more efficient for promoting exothermic reactions with an early transition state[3].
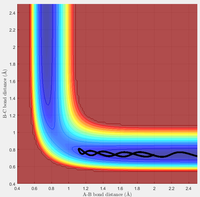
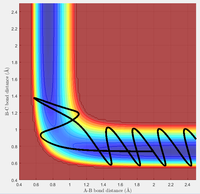
Figure 13 and 14 show two different trajectories for the endothermic H + HF reaction. In agreement with Polanyi's Rules, the case with initial conditions of high vibrational energy and low translational energy (Figure 13) results in a successful reactive pathway. The conditions with low vibrational energy and high translational energy (Figure 14) results in an unreactive trajectory, in further agreement of Polanyi's Rules.


Similarly, the exothermic reaction of F + H2 also seem to agree with the reverse rules. In these cases, translational energy seems more efficient for promoting an early-barrier reaction. The high translational energy case (Figure 15) results in a reactive trajectory while the low translational energy case leads to an unreactive trajectory (Figure 16).


However, although the examples shown above agree with Polanyi's Empirical Rules, the rules only state that there is a higher probability of a reactive trajectory if the conditions are satisfied. They do not state that trajectories can only be reactive is the conditions are satisfied. In this way, the rules are not exhaustive but provide a useful method of roughly predicting initial trajectories that are likely to be reactive.
References
1: P. Atkins, J. de Paula, Physical Chemistry: 10th Edition, Oxford University Press, 2014
2: Carruth, Gorton, Ehrlich, Eugene: Bond Energies, Gorton, Vol 1, 2002
3: Z. Zhang, Y. Zhou, D.H. Zhang, G. Czakó, J. M. Bowman: Theoretical Study of the Validity of the Polanyi Rules for the Late-Barrier Cl + CHD3 Reaction, The Journal of Physical Chemistry Letters 2012 3 (23), 3416-3419

