MRD:jh3416wiki
Molecular Reaction Dynamics
Identifying the Transition State
The transition state is a first order saddle point on a Potential Energy Surface, and mathematically defined as the point where the gradient=0. A local minimum represents a physically stable chemical species i.e. reactants and products; between any two minima the lowest energy pathway will pass through a maximum at a saddle point that represents the transition state. A local minimum also has a gradient = 0, so what’s the difference between a local minima or a saddle point mathematically?Sw2711 (talk) 22:32, 9 May 2019 (BST)
Estimating the Transition state
A trajectory was constructed and displayed At r = 0.92; AB and BC internuclear distances are equal, corresponding to a symmetric transition state and indicating the activated complex is in this region. Both internuclear distances were then set equal, and particles set to be stationary with all momenta 0, and the transition state was determined by trial and error. For the trajectory with r1=r2=0.92 it displays a small oscillation, where AB = BC. Plotting r1=r2 = 0.91, the oscillation observed is minimal, indicating this is the most stable (lowest energy) transition state. I think you could have done a better job than this. You would observe a straight line. There should be no oscillation at the TS. Sw2711 (talk) 22:33, 9 May 2019 (BST)

MEP vs Dynamics Trajectory
In a minimum energy pathway trajectory the particles momenta and velocity are reset to zero at every step, and so the trajectory corresponds to infinitely slow motion. The parameters were set as r1=rts +0.01, r2=rts, p1=p2=0. The outcome of this trajectory was the formation of a bond between B and C (r2=0.91) as the two closer atoms. This is illustrated by the following internuclear distance vs. time graph, which shows the AB distance increasing as the A atom migrates away, and oscillation in the BC distance indicating vibrational energy in the bond.
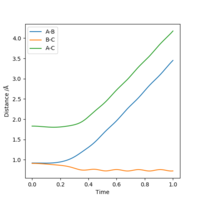
Reversing the values such that r1-=rts, r2=rts +0.01 showed the same outcome but for the AB bond. Changing the form to a dynamics trajectory shows oscillation of the trajectory in the potential energy surface due to vibrational motion in the newly formed H-H bond, which is not observed or taken into account in the MEP linear trajectory.
GoodSw2711 (talk) 22:38, 9 May 2019 (BST)
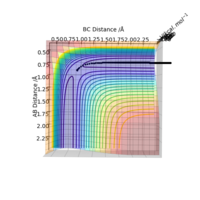
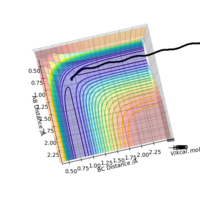
A calculation was then carried out in which the final inter-nuclear distances (r1 = 3.46, r2 = 0.74 Angstrom) and momenta (p1=2.49, p2 = 1.416) from the above calculation were inputted as initial values for a trajectory.
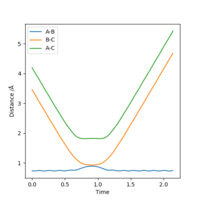
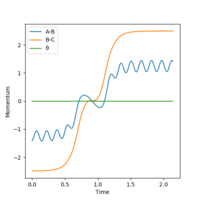
From the Internuclear Distance graph it can be seen that A approaches BC, indicated by a decreasing AB distance, up to a minimum bond distance which represents the transition state. The reaction then goes in the direction of reactants (BC forms, A departs) as the BC distance is shorter than the AV distance. The momentum of the atoms retains the same value in the initial and final state but changes sign (inversion); the atoms move away from each other rather than towards each other.
Description of Trajectory Dynamics
Trajectories were constructed with the same initial internuclear distances (r1 = 0.74, r2 = 2.0 angstroms) with varying initial momenta. The results are tabulated below. This part is very good. It would be perfect if you could include a set of screenshots in the table, so that I can visually see what you are describing.Sw2711 (talk) 22:40, 9 May 2019 (BST)
| p1 (BC) | p2 (AB) | Etot | Reactive? | Description of Dynamics |
|---|---|---|---|---|
| -1.25 | -2.5 | -99.018 | YES | AB distance steadily decreases, reaches symmetric transition state (A-B, B-C distances equal) then sharp increase in BC indicating departure of B atom, and oscillation of A-B distance indicating bond formation. |
| -1.5 | -2.0 | -100 | NO | AB inter-nuclear distance initially decreases as A approaches but AB momentum too small to initiate reaction, unable to cross energy barrier to form activated complex, and AB distance steadily increases again as A departs. |
| -1.5 | -2.5 | -98.956 | YES | Increase in AB momentum provides it with sufficient potential energy to cross barrier and react successfully. Pathway similar to row 1.
- |
| -2.5 | -5.0 | -84.956 | NO | A approaches and crosses over barrier at transition state, AB undergoes one oscillation as BC distance increases slightly. Separation not large enough and BC distance falls again and crosses back over the barrier, BC bond reformed.
- |
| -2.5 | -5.2 | -83.416 | YES | Barrier recrossing occurs twice, after which the BC internuclear distance sharply increases and AB distance begins oscillating steadily (AB bond formed). |
From the table barrier recrossing can be observed in the last two examples, which challenges the assumption that a collision with sufficient kinetic energy will always result in product formation.
Predictions from Transition State Theorʏ
Transition State Theory assumes nuclei behave according to classical mechanics. It also assumes the reaction will only occur if atoms collide with sufficient energy (E > Ea), not accounting for possibility of tunnelling, and that the reaction system will pass over the lowest energy saddle point on a potential energy surface. At high temperatures, this may not be the case; molecules populate higher vibrational modes, motion becomes more complex and collisions may lead to transition states far away from lowest energy saddle point. Furthermore, the theory assumes that once the activated complex has been formed the barrier cannot be crossed over back to the reactants, and it will onnly go in the direction of products. This is shown to not be the case by the presence of barrier recrossing seen in the data above. Hence, the experimental reaction rate would be lower than that anticipated by Transition State Theory as Transition state theory does not account for alternative pathways that do not result in product formation, 'quenching' the overall rate constant. Overall, very good research on TS theory, although We only studied one molecule, not molecules; and probably not at high temperatures either.Sw2711 (talk) 22:42, 9 May 2019 (BST)
H-F-H System
By inspecting the potential energy surfaces, classify the F + H2 and H + HF reactions according to their energetics (endothermic or exothermic). How does this relate to the bond strength of the chemical species involved?
To inspect the reactions, the H-H inter nuclear distance was set to 0.74 and the H-F distance set to 2.3 for the H2 + F reaction. It was deemed to be successful with a H-H momentum of -1.5 and a H-H momentum of -2.0 to -2.5. The final values (H-H distance = 2.24, p = -1.5, H-F distance = 1.21, momentum = 1.5) were then used as the initial values to construct the reverse reaction. The H2 + F reaction is exothermic; the stronger H-F bond formed in the products is lower in energy than the H-H bond broken in the reaction, and so an energy is taken from the surroundings. This can be seen in its potential energy surfaces; the products are lower in energy than the reactants. I think you probably get the point. But your way of explanation is a bit weird. It is exothermic. H-F bond is stronger than H-H bond, so the energy released to the surroundings from H-F formation is more than the energy required to break H-H bond. So HF molecule is overall lower in energy and hence more stable. Sw2711 (talk) 22:48, 9 May 2019 (BST)
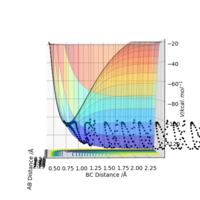
In contrast, in the H + HF reaction is endothermic, as the products are higher in energy than the reactants.

Locate the approximate position of the transition state
As the reaction is not symmetric as for the H + H2 system, it was necessary to identify the transition state using Hammonds Postulate, which states that the transition state of a reaction will resemble either the reactants or the products, depending on which of these it is closer to in energy. For the H2/F exothermic reaction, the transition state was assumed to be closer in energy to the reactants, and was found to be at r1 =1.5, r2 = 0.74.
You need a bit more work than this to show how you approached to the TS point values and confirm those values using a distance vs time diagram.Sw2711 (talk) 22:48, 9 May 2019 (BST)
Report the activation energy for both reactions.
The activation energy was estimated for the reaction by performing an MEP calculation with 1000 steps from a structure resembling the transition state, using the values r1 = 1.51, r2 = 0.74, p1 = p2 = 0. This was plotted on an energy vs time graph, and the activation energy was determined to be -28kj/mol for the H/HF reaction, and zero for the F/H2 reaction.
You need to show me how you got to those numbers. And I think your values are a bit offSw2711 (talk) 22:48, 9 May 2019 (BST)
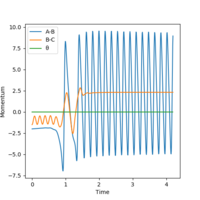
Identify a set of initial conditions that results in a reactive trajectory for the F + H2, and look at the “Animation” and “Momenta vs Time”. In light of the fact that energy is conserved, discuss the mechanism of release of the reaction energy. Explain how this could be confirmed experimentally.
The initial conditions that resulted in a reactive trajectory were r1(HF) = 2.3-3.0, r2(HH)=0.74, p1(HF) = -2.0 to -2.5, p2(HH) = -1.5. Shown below is a Momenta vs Time graph for a trajectory with initial values r1 = 2.3, r2 = 0.74, p1 = -2.0, p2 = -1.5.
You still haven’t explained how this could be confirmed experimentally in a wet lab.Sw2711 (talk) 22:48, 9 May 2019 (BST)
Where is your answer for the last question? You clearly spent reasonable time on the first part and rushed through the second part. Sw2711 (talk) 22:50, 9 May 2019 (BST)
