MRD:jg2016
H + H2 System
1. What value do the different components of the gradient of the potential energy surface have at a minimum and at a transition structure? Briefly explain how minima and transition structures can be distinguished using the curvature of the potential energy surface.
All components of the gradient are equal to 0 at a local minimum. At a transition structure the potential energy surface would be at a local maximum and so the gradient will also be 0. Once a point in the surface plot has been found that has a gradient of 0, it can be determined whether it is a local minimum or a transition state by calculating the second derivative at that point. If the second derivative is a positive number then the point is a local minimum and if it is a negative number the point is a transition state.
So do you mean a TS is a local maximum? That's not true. A saddle point is a maximum and a minimum at the same time, depending on which direction you are looking at (i.e. at which plane you are looking at the curve). Generally a saddle point is a maximum if you look from one direction and a minimum if you look from the other direction. (You have multiple 2D planes to look at the curvatures, because it is a 3D plot). For a local minimum or local maximum, it will be all min or max at all directions of the planes. Please have a look at this pringles , if that helps. In terms of how to differentiate whether it is a min/max or saddle point for a maths meaning, please watch this video. link 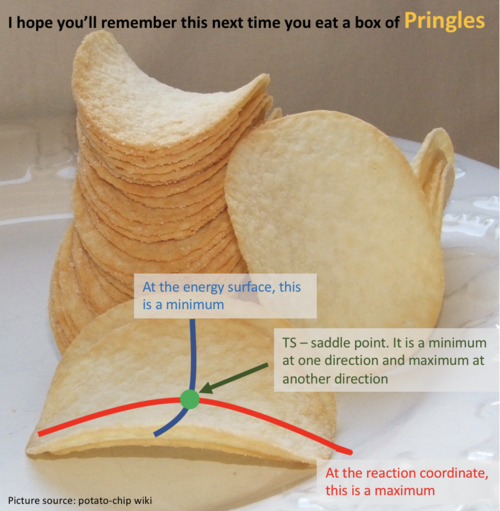 --Sw2711 (talk) 12:36, 21 May 2018 (BST)
2. Report your best estimate of the transition state position (rts) and explain your reasoning illustrating it with a “Internuclear Distances vs Time” plot for a relevant trajectory.
The value for the internuclear distance of the transition state was found to be 0.908 Å.
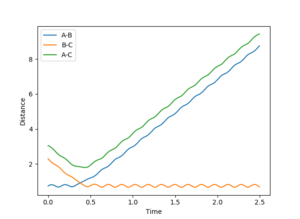
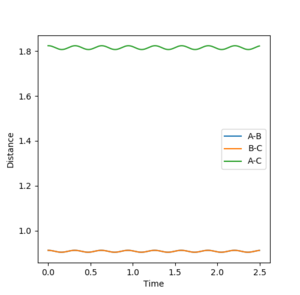
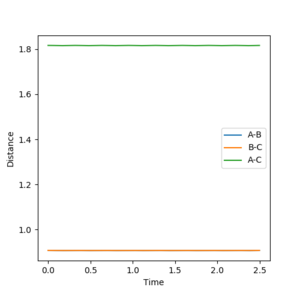
Figure 1 shows a graph of internuclear distance against time. The internuclear distance of the transition state was accessed by finding the point of intersection between r1 and r2. Figure 2 shows a closeup of the intersection where the internuclear distance of 0.916 Å, so this distance was used as a starting point to find the true internuclear distance of the transition state.
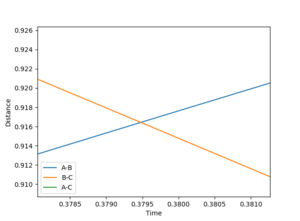
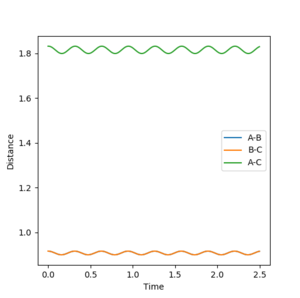
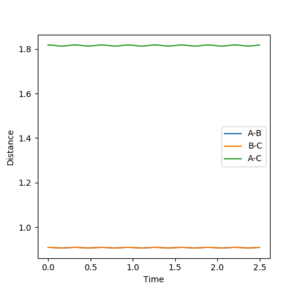
Using r1=r2=0.916 and p1=p2=0 as the parameters for calculation, figure 3 shows the internuclear distance against time graph. As can be seen there is a slight oscillation in the internuclear distance over time showing that this is not a energy minimum for the transition state. The value of r must yield an internuclear distance against time graph which is a straight line showing that there is no oscillation and the minimum has been achieved for the transition state. 0.912 Å and 0.908 Å were then tested with 0.908 Å showing the least oscillation even when compared to 0.909 Å and 0.907 Å.
Good. Nice explanation and evidence. If you have too many figures, maybe you could consider to put them in a big table.--Sw2711 (talk) 12:46, 21 May 2018 (BST)

3. Comment on how the mep and the trajectory you just calculated differ.
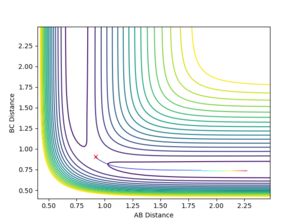

The first figure please say Figure 8. That's why you numbered them. --Sw2711 (talk) 12:46, 21 May 2018 (BST) shows a trajectory pathway of the reaction after the transition state using mep calculations and the second figure Figure 9--Sw2711 (talk) 12:46, 21 May 2018 (BST)shows the trajectory pathway using dynamic calculations. The calculation was performed using r1=0.918 Å, r2=0.908 Å and p1=p2=0. In the mep calculation there is a smooth descent to products with a BC distance in approximately 0.74 Å. In the dynamic calculation, the BC distance also subtends to an equilibrium distance of approximately 0.74 Å but it oscillates as it subtends. This is because the mep calculation is the minimum energy pathway that resets the velocity to 0 after every step. As the velocity of the atoms is reset to 0 after every step, the kinetic energy of the molecules is 0 and so there is no vibrational energy or oscillations. The dynamic calculation doesn't reset the velocity to 0 after every step and so the product H2 molecule will have vibrational energy resulting in BC length oscillations.
If the value of r1 and r2 were switched then to trajectory would subtend towards a BC length of approximately 0.74 Å and AB distance would be continuously increasing. This is because the molecule will be on the reactant side of the transition state and so will fall back to the reactants.
This part of study is good. --Sw2711 (talk) 12:46, 21 May 2018 (BST) 4. Complete the table by adding a column with the total energy, and another column reporting if the trajectory is reactive or unreactive. For each set of initial conditions, provide a plot of the trajectory and a small description for what happens along the trajectory.
Using r1=0.74 Å and r2=2.0 Å
| p1/kg ms-1 | p2/kg ms-1 | Total Energy/ kcal mol-1 | Reactivity |
|---|---|---|---|
| -1.25 | -2.5 | -99.018 | Reactive |
| -1.5 | -2.0 | -100.456 | Unreactive |
| -1.5 | -2.5 | -98.956 | Reactive |
| -2.5 | -5.0 | -84.956 | Unreactive |
| -2.5 | -5.2 | -83.416 | Reactive |
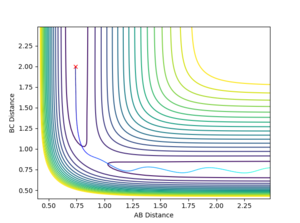
This first set of initial conditions resulted in a reaction occurring. The initial species of molecule AB had no vibrational energy and so doesn't oscillate. The total momentum of the system is -3.75 kg ms-1 and so is sufficient to overcome the activation energy of the reaction and form the transition state. Once this has had formed the particles fell into the local energy minimum of the products which is particle A and molecule BC. The species BC oscillates as it propagates because some of the initial kinetic energy has been converted into vibrational energy during the collision.

This second set of initial conditions resulted in a no reaction occurring. The initial species of molecule AB has vibrational energy as the momentum of AB is slightly higher and so it does oscillate. The total momentum of the system is -3.5 kg ms-1 and so is not sufficient to overcome the activation energy of the reaction and form the transition state. This means that the particles fall back to the reactants of particle C and molecule AB.
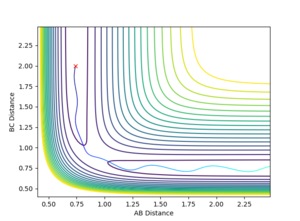
This third set of initial conditions resulted in a reaction occurring. The initial species of molecule AB has vibrational energy as the AB momentum is the same as in the second set of initial conditions and so oscillates. The total momentum of the system is -4.0 kg ms-1 and so is sufficient to overcome the activation energy of the reaction and form the transition state. Once this has had formed the particles fell into the local energy minimum of the products which is particle A and molecule BC. The species BC oscillates as it propagates because some of the initial kinetic energy has been converted into vibrational energy during the collision.

This fourth set of initial conditions resulted in no reaction occurring. The initial species of molecule AB has vibrational energy as the AB momentum is very high so it oscillates. The total momentum of the system is -7.5 kg ms-1 and so is sufficient to overcome the activation energy of the reaction and form the transition state. Once this has had formed the particles fell into the local energy minimum of the products which is particle A and molecule BC. However, after these species have formed the momentum of the system is so high that a transition state is formed again where the AB and BC distance is the same. This allows the AB species to form again so the particles end up falling to the reactants.
I think the word you are looking for is 'recrossing the TS'--Sw2711 (talk) 12:46, 21 May 2018 (BST)
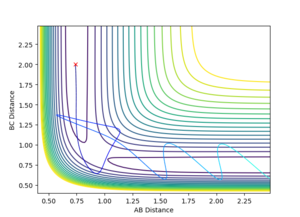
This final set of initial conditions resulted in a reaction occurring. The total momentum of the system is -7.7 kg ms-1 and so is sufficient to overcome the activation energy of the reaction and form the transition state. Once this has had formed the particles fell into the local energy minimum of the products which is particle A and molecule BC. However, after these species have formed the momentum of the system is so high that a transition state is formed again where the AB and BC distance is the same. This allows the reactants to form again but they also have such a high momentum that they form a transition state again and eventually produce the products resulting in an overall reaction
5. State what are the main assumptions of Transition State Theory. Given the results you have obtained, how will Transition State Theory predictions for reaction rate values compare with experimental values?
The main assumptions of Transition State Theory are;
1. Electron and Nuclear motion are viewed as separate.
2. If a molecular system has crossed the transition state in the direction of the products then it cannot fall back and form the reactants.
3. Once the transition state has been reached, movement along the reaction coordinate can be viewed as translational and is separate from all other forms of motion.
4. Even when the reactants and products are not in equilibrium, the population of transition states that are becoming products can be modeled using the Maxwell-Boltzmann distribution.[1]
In reality when the transition state is reached for a molecule then some of them will infact fall back to the reactants so calculations using transition state theory will slightly overestimate the rate of reactions. Transition state theory also doesn't take into account any tunneling effects as it treats the particles in a classical manner. This will be represented by a slight underestimation of the rate as some molecules which would have been thought to be too low energy would be able to tunnel energy barrier and reach the products without moving through the transition state. Overall the lower overestimation of the rate of reaction due to assumption 2 will have a larger contribution to the error than the underestimation due to quantum tunneling so overall calculations based on transition state theory will overestimate the rate of reactions.
Good study. Just one minor notice: the term ‘equilibrium’ or 'distribution' is not very applicable here. ‘equilibrium’ is mainly used in statistical thermodynamics. But in terms of your system, there are only 3 atoms. So, it is either one way or the other. --Sw2711 (talk) 12:46, 21 May 2018 (BST)
F-H-H System
6. Classify the F + H2 and H + HF reactions according to their energetics (endothermic or exothermic). How does this relate to the bond strength of the chemical species involved?
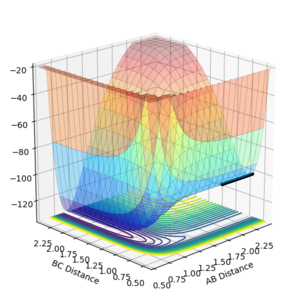
On the surface plot above the AB value denotes the distance between F-H and the BC value denotes the distance between H-H. At large values of AB, BC distance has a higher energy minimum than the AB distance energy minimum at large values of BC. This means that the BC molecule with A as a particle is higher energy than the AB molecule with C as a particle.
| Reaction | Endothermic/Exothermic |
|---|---|
| F + H2 | Exothermic |
| H + HF | Endothermic |
The enthalpy change of a reaction is the sum of the energy required to break bond and and the energy released when forming bonds. As the first reaction is exothermic, then more energy is released forming bonds then is required to break bonds so F-H bond formed is higher energy than the H-H bond broken.
Good--Sw2711 (talk) 12:50, 21 May 2018 (BST)
7. Locate the approximate position of the transition state.
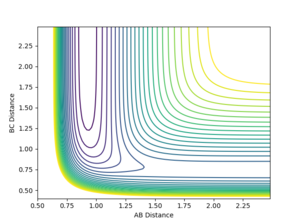
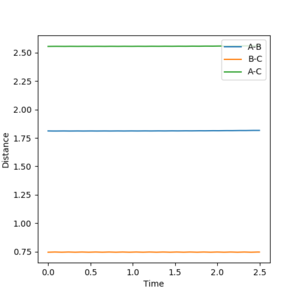
From the surface plot it can be seen that transition state will be on a saddle point instead of a local energy maximum like it was for the H-H-H system. From the contour plot it can seen that this saddle point will be between 0.70 Å and 0.90 Å for the value of BC and and 1.50 Å to 2.25 Å for the value of AB. As BC is the internuclear distance of the H-H it can be estimated that this is close to the H-H internuclear distance calculated for the H-H-H system which was 0.74 Å and through trial and error the actual AB and BC value for the transition state was found. The method for assessing whether the internuclear distance of the transition state had been found as seeing whether there were no oscillations when distances were inputed and the momenta was set to 0.
Good--Sw2711 (talk) 12:50, 21 May 2018 (BST)
AB=1.8115 Å
BC=0.7445 Å
8. Report the activation energy for both reactions.
To find the activation energy of each reaction, The molecules were displaced slightly from their positions in the transition state and the energy difference as they move to the products recorded using a meps calculation with 50,000 steps.
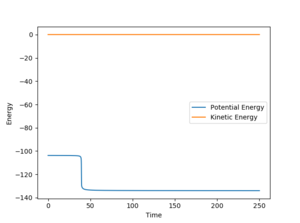
To find the activation energy for HF + H, the value of r1 was set to 1.7615 Å (which is the rt1-0.05 Å) and value of r2 was kept at 0.7445 Å. The AB and BC momenta were both set to 0 and the activation energy calculated was +30.166 kcal mol-1. (Calculated from -103.795 kcal mol-1 - -133.961 kcal mol-1 as can be seen below)
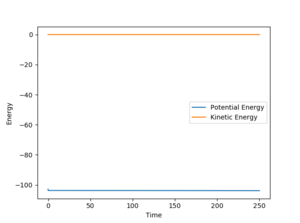
To find the activation energy for F + H2, the value of r1 was set to 1.8115 Å (which is the rt1) and value of r2 was set to 0.7945 Å (which is rt1+0.05 Å). The AB and BC momenta were both set to 0 and the activation energy calculated was +0.886 kcal mol-1. (Calculated from -102.867 kcal mol-1 - -103.753 kcal mol-1 as can be seen below)
Good--Sw2711 (talk) 12:50, 21 May 2018 (BST)
Reaction Dynamics
| Parameter | Value |
|---|---|
| F-Ha distance | 2.25 Å |
| Ha-Hb distance | 0.7445 Å |
| p1 | -1.1 kg ms-1 |
| p1 | -2 kg ms-1 |
The parameters above were chosen to showcase a successful reaction between F + H2

9. In light of the fact that energy is conserved, discuss the mechanism of release of the reaction energy. How could this be confirmed experimentally?
Initially the H2 molecule is vibrating as it approaches the F, there is interconversion of potential energy between the 2 H atoms and kinetic energy of the 2 atoms. Once the Ha gets close to the F atom, the Ha-Hb momentum is transferred to F-Ha. This means that the majority of potential energy in the system is converted into kinetic energy. At this point F and Hb are largely stationary so Ha has most of the kinetic energy in the system. It will therefore rapidly move between F and Hb before eventually converting most of its kinetic energy into potential energy with F and kinetic energy to Hb.
Good, so how could this be confirmed experimentally?--Sw2711 (talk) 13:01, 21 May 2018 (BST)


10. Discuss how the distribution of energy between different modes (translation and vibration) affect the efficiency of the reaction, and how this is influenced by the position of the transition state.
Polanyi's empirical rules state that if a reaction has a early transition state then translational energy is better at promoting a reaction and also that if a reaction has a late transition state then vibrational energy is better at promoting a reaction to occur.[2] The reaction between F + H2 has an early transition state and the reaction between HF + H has a late transition state. Why are you so certain that F+H2 has an early TS and HF+H has a late TS?--Sw2711 (talk) 13:01, 21 May 2018 (BST)
For F + H2, the F-Ha momentum would be a measure of translational energy and the Ha-Hb momentum would be a measure of the vibrational energy. Therefore it could be theorized that initial conditions with high F-Ha momentum and low Ha-Hb momentum would promote this reaction.
Just a notice: not all momentum you put in F-H here would turn into translational energy. Same for HH momentum. The way to check the actual vibrational energy is to check how many contour lines it has passed.--Sw2711 (talk) 13:01, 21 May 2018 (BST)
| Parameter | Value |
|---|---|
| F-Ha distance | 2.25 Å |
| Ha-Hb distance | 0.74 Å |
| p1 | -2 kg ms-1 |
| p1 | -0.1 kg ms-1 |
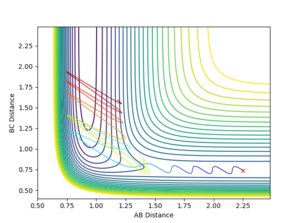
If the energy to overcome the activation energy comes mainly in the vibrational form then the reaction is less likely to occur
| Parameter | Value |
|---|---|
| F-Ha distance | 2.25 Å |
| Ha-Hb distance | 0.74 Å |
| p1 | -0.1 kg ms-1 |
| p1 | -5.5 kg ms-1 |

For HF + H<, the F-Ha momentum would be a measure of vibrational energy and the Ha-Hb momentum would be a measure of the translational energy. Therefore it could be theorized that initial conditions with high F-Ha momentum and low Ha-Hb momentum would promote this reaction.
| Parameter | Value |
|---|---|
| F-Ha distance | 0.92 Å |
| Ha-Hb distance | 2 Å |
| p1 | -13 kg ms-1 |
| p1 | -0.1 kg ms-1 |
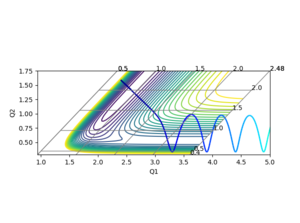
If the energy to overcome the activation energy comes mainly in the translational form then the reaction is less likely to occur
| Parameter | Value |
|---|---|
| F-Ha distance | 0.92 Å |
| Ha-Hb distance | 2 Å |
| p1 | -0.2 kg ms-1 |
| p1 | -7 kg ms-1 |
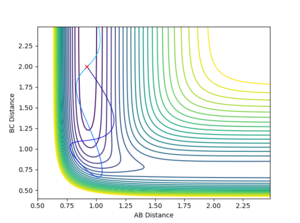
Good experiments, just one question. When you make a comparison of high translational energy and low vibrational energy vs low trans and high vib, why do you use different momenta? Why don't you simply swap the numbers? --Sw2711 (talk) 13:01, 21 May 2018 (BST)
References
- ↑ Steinfeld, J., Hase, W. and Francisco, J. (1999). Chemical kinetics and dynamics. Upper Saddle River, N.J.: Prentice Hall, p.331.
- ↑ Zhang, Z., Zhou, Y., Zhang, D., Czakó, G. and Bowman, J. (2012). Theoretical Study of the Validity of the Polanyi Rules for the Late-Barrier Cl + CHD3 Reaction. The Journal of Physical Chemistry Letters, 3(23), pp.3416-3419.
