MRD:jc6116
Molecule dynamic reaction
Introduction
Transition State theory
1.Molecular system that have crossed the transition state in the direction of product cannot turn around and reform reactant.
2.In the transition state, motion along the reaction coordinate may be separated from the other motion s and treated classically as translation.
3.Even in the absence of an equilibrium between reactant and product molecules, the transition states that are becoming products are distributed among their states according to the Maxwell-Boltzmann laws.
Reaction Encounter
The rate of the reaction,ν is directly proportional to the frequency of collision, and therefore successful collision only if the kinetic energy exceeds the the minimum energy requirement (Activation Energy).
Potential Energy Surface
Hammond postulate
Endothermic reactions the transition state resembles the reaction products, while for exothermic reactions the transition state resembles the reaction reactant.
Polanyi's empirical rules
Exercise 1 H-H-H system
Q1: On a potential energy surface diagram, how is the transition state mathematically defined? How can the transition state be identified, and how can it be distinguished from a local minimum of the potential energy surface?
Answer (1): The transition state of the potential energy surface diagram is the Saddle Point of the diagram, which is maximum on the minimum energy path linking reactants and the products.
| Type of Point | Mathmetical definition |
|---|---|
| Saddle Point | 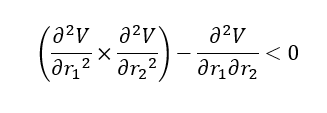
|
| Local Minimum | 
|
Good explanation, worth mentioning it is a maximum on the LOWEST energy pathway. Clear table with the mathematical explanation, but perhaps a sentence to comment on the gradient and the order of the saddle point, what should these be? Mys18 (talk) 14:17, 14 May 2019 (BST)
Q2: Report your best estimate of the transition state position (rts) and explain your reasoning illustrating it with a “Internuclear Distances vs Time” plot for a relevant trajectory.
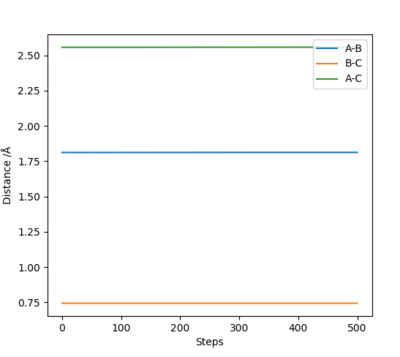
Answer (2) : Using the MEP method and set the parameter which r1 = r2 =1.2, and p1 = p2 = 0.0.
The rts=0.9077Å with the minimum potential energy.
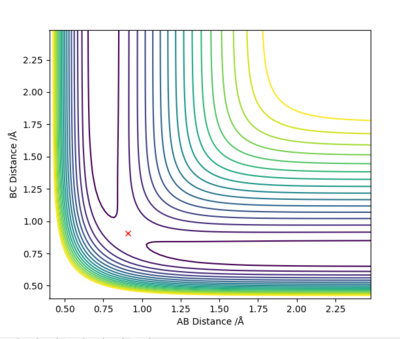
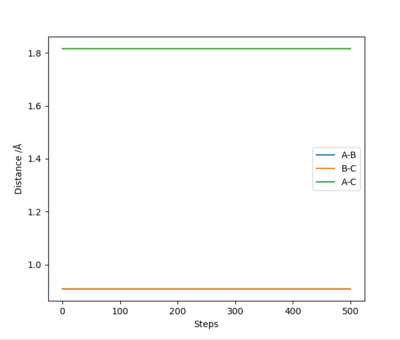
At this the Point r1 = r2 = 0.9077Å, grad V(r1,r2) = 0. In addition, the internucaler distance do not change during rhe time. Thus, this is the saddle point of the potential energy surface, which mean it is the transition state of reaction.
Typo - internuclear. Simple and clear explanation, good job. Might be worth labelling your figures with Figure 1, Figure 2 etc. so that you can link them to your written explanations. Mys18 (talk) 14:33, 14 May 2019 (BST)
Q3: Comment on how the mep and the trajectory you just calculated differ.
Answer (3) : set the parameter of r1 = 0.918 and r2 = 0.908, and p1 = p2= 0.
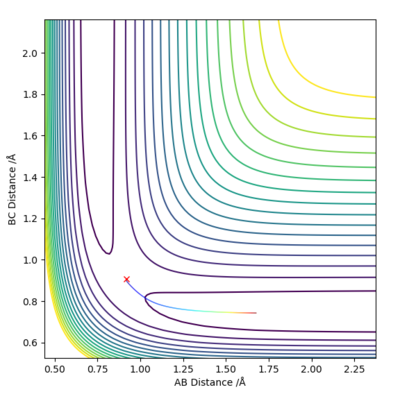
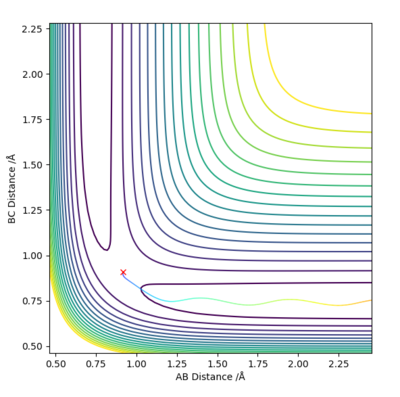
For MEP method the Kinetic energy are allows set to be zero, which means the velocity, momentum and vibration motion of the molecule disappeared during the reaction. Therefore, the total energy is not conserved. For Dynamic method the Kinetic energy are conserved, the vibration motion are showed on the Contour Plot
Excellent! Perhaps add some more simpler details to explain what we are looking at on the contour plot...'vibration motion is shown on the MD contour plot above as the trajectory is oscillating. Mys18 (talk) 14:53, 14 May 2019 (BST)
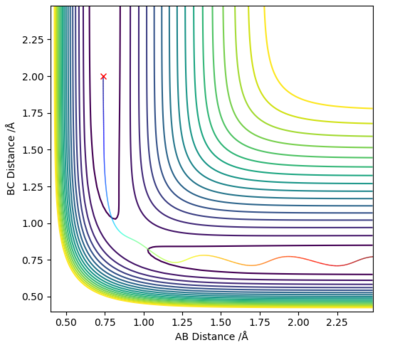
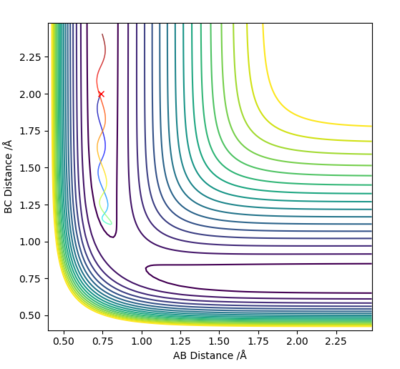
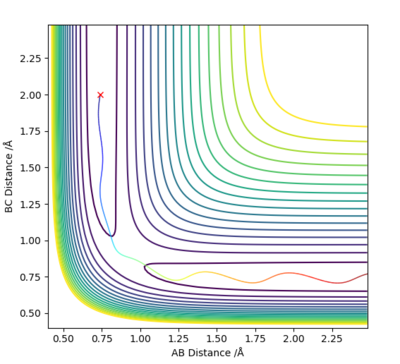
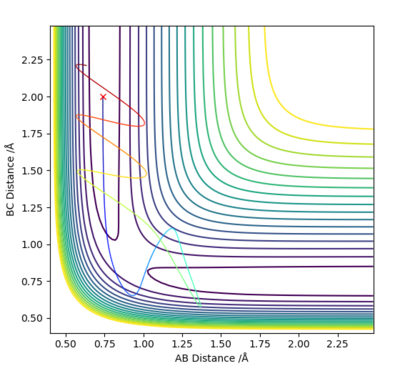
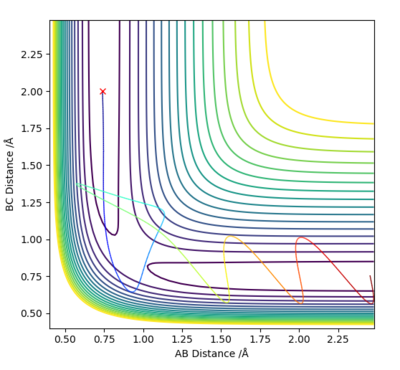
Q4 :Complete the table above by adding the total energy, whether the trajectory is reactive or unreactive, and provide a plot of the trajectory and a small description for what happens along the trajectory. What can you conclude from the table?
Answer (4) :
For the initial positions r1 = 0.74 and r2 = 2.0, run trajectories with the following momenta combination and complete the table.
Conclusion:
The reactant star at same position with same potential energy, but with different momentum (Kinetic energy)
1. Increasing in the Kinetic energy of initial reactant, making the reaction reactive.
2. The higher Kinetic energy cannot guarantee the successful reaction.
3. The higher Kinetic energy may cause the reform of the reactant from product even it passed transition state
Nicely laid out table that has been correctly filled out. Appreciate the clear conclusions at the end. Although you have mentioned the transition state briefly in conclusion 3. It would be worth mentioning it in each of the dynamic descriptions. For the first row you rightly mentioned Atom C has sufficient kinetic energy, but for what? make it incredibly clear to whoever is reading this that you know exactly what is going on (no doubt your answers show you do!), but perhaps add the extra description eg, 'The atoms/molecule have enough momentum to overcome the energy barrier at the TS, therefore reaction occurs'. Mys18 (talk) 15:05, 14 May 2019 (BST)
Q5: State what are the main assumptions of Transition State Theory. Given the results you have obtained, how will Transition State Theory predictions for reaction rate values compare with experimental values?
Answer (5) : Transition State theory 1
1. A molecular system that has crossed the transition state in the direction of a product cannot turn around and reform reactant.
2. In the transition state, motion along the reaction coordinate may be separated from the other motion and treated classically as translation.
3. Even in the absence of equilibrium between reactant and product molecules, the transition states that are becoming products are distributed among their states according to the Maxwell-Boltzmann laws.
4. Electronic and nuclear motions are separated due to the large difference in mass.
The result from the Answer (5) :
it can be seen that the product will reform back to the reactant which conflicts with the first assumption in the fourth reaction. Which means the rate of the reaction decrease due to the reformation of the reactant.
Moreover, other assumptions cannot be verified due to insufficient experimental results
Fantastic, good interpretation of Assumption 1's effect on the rate of reaction. For Assumption 4. - who's approximation is this? What is the relevance of the electrons motion on the nucleus' motion such that they are seperated? Mys18 (talk) 15:17, 14 May 2019 (BST)
Exercise : F - H - H system
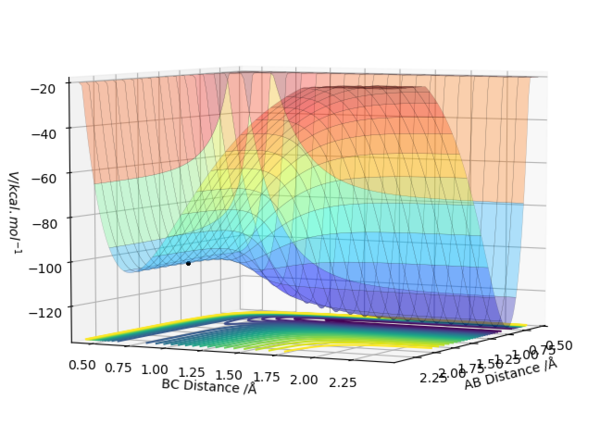
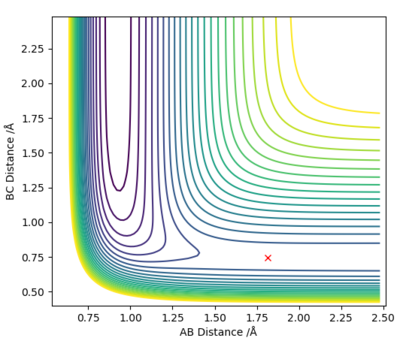
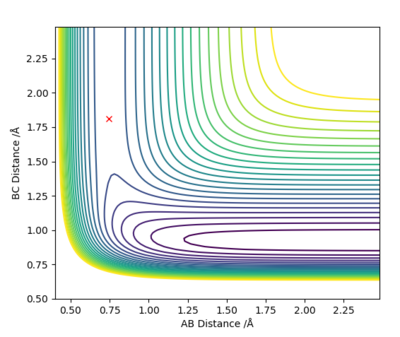
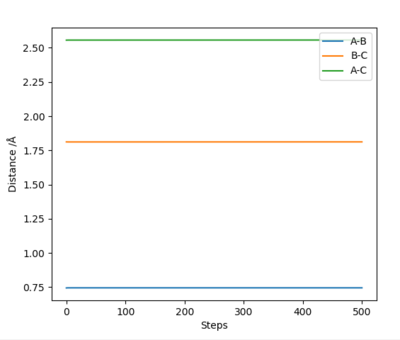
Q6: By inspecting the potential energy surfaces, classify the F + H2 and H + HF reactions according to their energetics (endothermic or exothermic). How does this relate to the bond strength of the chemical species involved? Locate the approximate position of the transition state.
Answer (6) :
| Type of reaction | Energetic | Bond Strength | Position of Transition State |
|---|---|---|---|
| F + H2 → HF + H | Exothermic | Formation of HF Bond (-565 KJ/mol) and Breaking H2 Bond (+436KJ/mol) | r1 = 1.812 , r2 = 0.744 |
| H + HF → F + H2 | Endothermic | Formation of H2 Bond (-436KJ/mol) and Breaking HF Bond (+565 KJ/mol) | r2 = 1.812 , r1 = 0.744 |
 |
 |
|---|
 |
 |
|---|
Correct findings, but again perhaps spend time writing up a sentence to show how you arrived at such answers eg, What does Hammonds Postulate state that allows you to conclude if the reaction is endo/exothermic? How did you know that is the position of the TS? With bond strength you have quoted values, but what do these mean? Does more energy need to be put in when breaking a stronger bond...is this shown by the more +ve value? Mys18 (talk) 16:36, 14 May 2019 (BST)
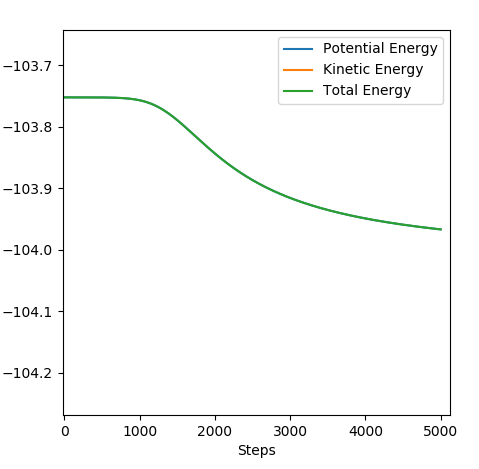
Q7 :Report the activation energy for both reactions.
Answer (7) :
| Type of reaction | Activation Energy |
|---|---|
| F + H2 → HF + H | 0.21 kcal/mol |
| H + HF → F + H2 | 31.13 kcal/mol |
 |
 |
|---|
Why do these values differ? Mys18 (talk) 16:37, 14 May 2019 (BST)
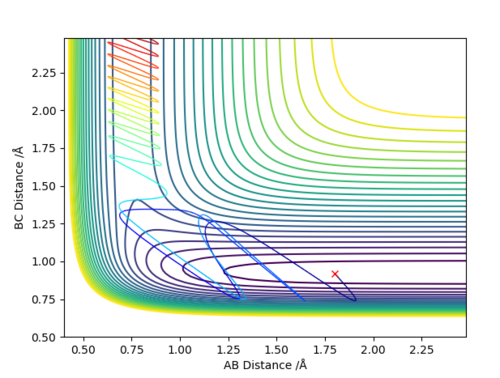
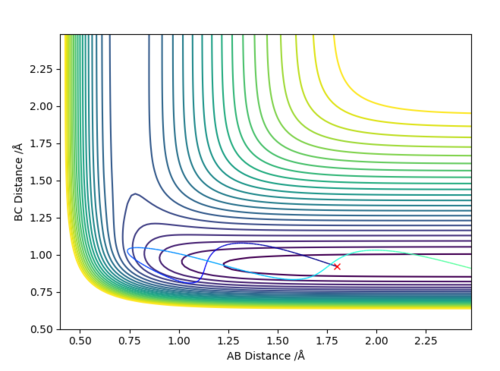
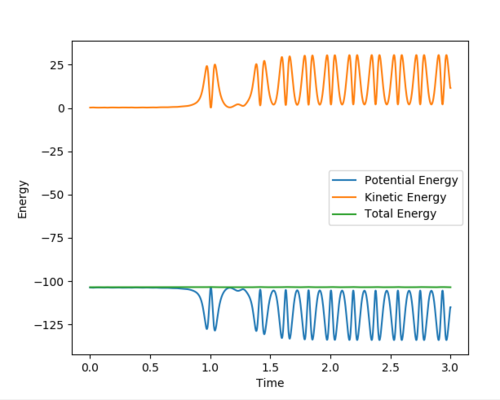
Q8 :In light of the fact that energy is conserved, discuss the mechanism of release of the reaction energy. Explain how this could be confirmed experimentally.
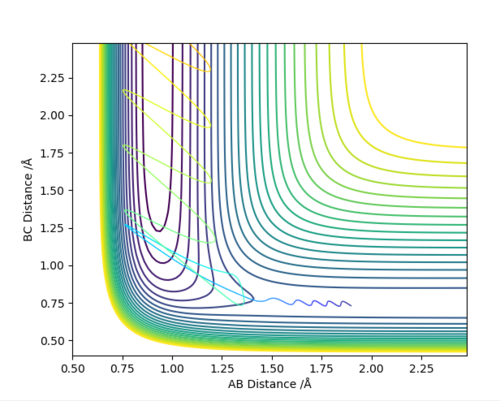
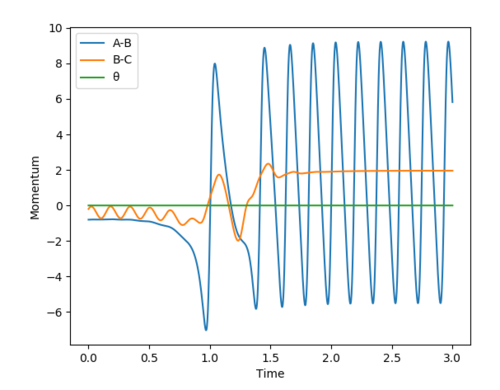
Answer (8) : The initial condition of the reaction r1 = 1.9 and r2 = 0.73, PHF= -0.8 and PHH = -0.2
 |
 |
 |
|---|
After the reaction takes place, the potential energy decreased and the increase in Kinetic energy. It can be observed from the increasing of Temperature of the reaction mixture. Moreover, the Initially the B-C bond which corresponding to H-H is vibrating. After the reaction, the formation of the H-F bond, and the excess energy was transferred to the vibration energy between H and F atom. Therefore, the intermolecular momentum between B-C flattened and A-B momentum is vigorously oscillating. This can be observed in changing the vibration state.
Excellent, so what is an experimental technique we could use to measure the temperature change in a sealed system? Quite rightly you have mentioned the presence of vibrations, what is a common spectroscopy technique that could be used to calculate the vibrational energies? Mys18 (talk) 16:37, 14 May 2019 (BST)
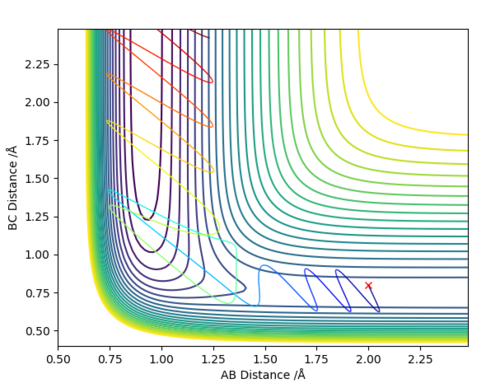
Q9 :Discuss how the distribution of energy between different modes (translation and vibration) affect the efficiency of the reaction, and how this is influenced by the position of the transition state.
Answer (9) :
| Type of reaction | Type of transition state |
|---|---|
| F + H2 → HF + H | ealier transtion state |
| H + HF → F + H2 | later transtion state |
The positions of the molecule are started at the reactant, with different vibration and translation energy.
For the endothermic reaction ( HF + H → H2 + F ), the maximum of the later barrier occurs in the reaction path. Thus, vibration energy in the reactants will be more effective than the translation ( Kinetic ) energy in crossing the barrier.
For the exothermic reaction ( F + H2 → HF + H ), the earlier barrier occurs in the reaction path. Thus, translation energy in the reactants will be more effective than the vibration energy in crossing the barrier.
Therefore, the early transition state prefers higher translation energy, and late transition state prefers vibration energy.
First and foremost, your report was well structured and easy to navigate. In addition to this, your answers were clear and concise with no technical faults. However, as some advice it would be useful if you labelled your figures and directly linked them to your descriptive answers. As well as this, although you have done a great job at laying out the correct figures to show your answers, it may be worth adding an extra sentence to explain what the figure/data is trying to tell us. Great job! :) Mys18 (talk) 16:58, 14 May 2019 (BST)
Reference
[1] J. I. Steinfeld, J. S. Francisco, W. L. Hase, Chemical Kinetic and Dynamics, Prentice-Hall, New Jersey, 1998


