MRD:im3117
Exercises
Exercise 1: H + H2 system
Task 1
On a potential energy surface diagram, how is the transition state mathematically defined? How can the transition state be identified, and how can it be distinguished from a local minimum of the potential energy surface?
On a potential energy surface diagram, the transition state is the maximum of the minimum energy path from reactants to products, such that ∂V/dr is equal to zero as well as that ∂V2/dr2 is greater than zero. It can be distinguished from other local minima by ensuring that ∂V/dq1 = 0 and ∂V/dq2 = 0. q1 can be defined as the tangent along the minimum of the reaction pathway and q2 can be defined as a line orthogonal to this tangent. To ensure that the minimum is not a local minimum, ∂V2/dq12 < 0 and ∂V2/dq22 > 0 for that point. Good attempt but there is some confusion, the local maximum is when the second partial derivative is less than zero not greater than zero. Sf3014 (talk) 12:17, 21 May 2019 (BST)
Task 2
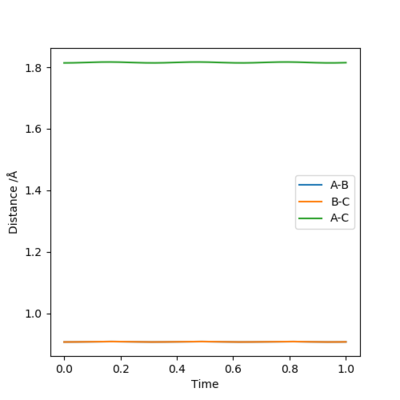
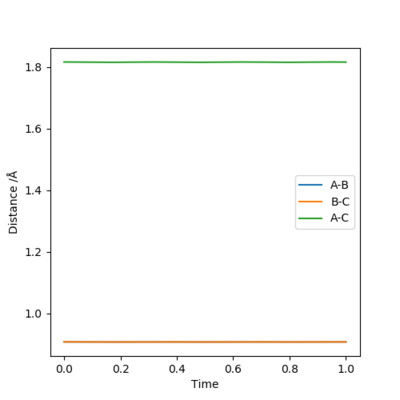
Report your best estimate of the transition state position (rts) and explain your reasoning illustrating it with a “Internuclear Distances vs Time” plot for a relevant trajectory.
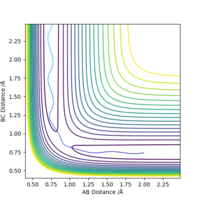
My best estimate for the transition state position is 0.908 Å because the gradient of the r1 and r2 plots on an internuclear distance by time graph is zero. Either side of this value, i.e. 0.907 Å and 0.909 Å do not have constant gradients and have an oscillatory nature.
Well done but how did you get to that value?. Sf3014 (talk) 12:24, 21 May 2019 (BST)
Task 3
Comment on how the mep and the trajectory you just calculated differ.
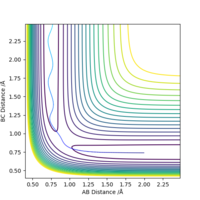
The algorithm involved in both calculations involves finding the path of steepest descent along the potential energy surface in order to find a minimum. With the mep calculation, after every step, the kinetic energy is reset to zero, whereas with the dynamic calculation the kinetic energy from the previous step is carried over. This means the calculation continues whereas with the mep calculation, the potential energy calculated remains at the minimum. Visually, this is seen as an oscillating line with the dynamic mode as the kinetic energy is not set to zero whereas it results in a plateaued line as the kinetic energy is reset to zero at every interval.
What is your first statement based on? Meaning, what are your initial positions and momenta, for this observation? More description needed and next time include graphs especially when you mention visual observations. Sf3014 (talk) 12:35, 21 May 2019 (BST)
Task 4
Complete the table by adding the total energy, whether the trajectory is reactive or unreactive, and provide a plot of the trajectory and a small description for what happens along the trajectory. What can you conclude from the table?
(Table 1)
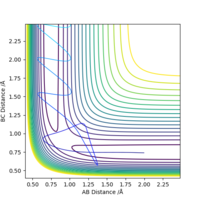
From Table 1, it is possible to conclude that the total energy of the system depends on the momentum of the system as it is related to the kinetic energy of the system. The momentum of the particles very much determines whether they will react or not, rather than just the energy of the system. If p2 (the momentum of B-C) is small when compared with p1, the molecule may rebound and not react.
Observations are okay but it did not seem like you were describing the reaction pathways, in your table. Also, you last statement on p2, please give an example for a case where p2 is less than p1. Sf3014 (talk) 12:47, 21 May 2019 (BST)
Task 5
State what are the main assumptions of Transition State Theory. Given the results you have obtained, how will Transition State Theory predictions for reaction rate values compare with experimental values?
Transition State Theory explores the reaction rates of chemical reactions, assuming the existence of quasi-equilibrium, a form of chemical equilibrium, between reactants and transition state complexes. The configuration of this complex is called the 'activated complex' and is the intermediate form at which the maximum potential energy occurs. The difference in energy between the reactants and the energy of the activated complex is closely related to the activation energy of the reaction[1].
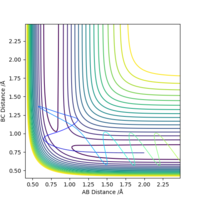
The quasi-equilibrium state can be described using the thermodynamic treatment of the theory. The theory assumes that the activated complex is always in quasi-equilibrium with the reactants, even when the reactants and products are not in equilibrium with each other. The thermodynamic treatment can be summarised using the Van't Hoff equation, which describes the temperature dependence of the equilibrium constant for a reversible reaction, as seen in Equation 1.
Eq.1
where ΔU is the change in internal energy, K is the equilibrium constant of the reaction, R is the universal gas constant, and T is thermodynamic temperature.
Integration of this equation leads to Equation 2, otherwise known as the Arrhenius equation.
Eq.2
where k is the rate constant.
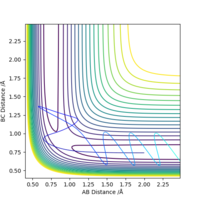
As we have shown that the reaction can be unsuccessful as barrier recrossing occurs, as seen in Fig.8, it is expected that the rate constant is lower in experiment than the theory suggests.
Good but what does this mean in terms of the reaction process? What does transition state theory tell you about the process of a reaction and how it will proceed to the reactants every time? Hint: Its to do with the activation energy. Also, does this agree with your table of reactions above?. Sf3014 (talk) 13:01, 21 May 2019 (BST)
Exercise 2: F - H - H system
Task 1
By inspecting the potential energy surfaces, classify the F + H2 and H + HF reactions according to their energetics (endothermic or exothermic). How does this relate to the bond strength of the chemical species involved?
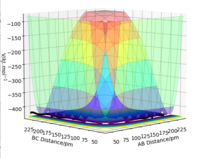
By looking at the potential, energy surfaces, F + H2 → HF + H is an exothermic reaction as the products are lower in energy than the reactants, as seen in Fig.9. The backwards reaction must be endothermic. This can be seen by looking at the plot for H + HF → H2 + F which concurs that the reaction is endothermic because the products are higher in energy than the reactants so energy is required from the surroundings to overcome the potential energy barrier. Therefore, the reverse reaction must be exothermic.
Since F + H2 → H + HF is an exothermic reaction and bond making is an exothermic process, the H-F bond must be stronger than the H-H bond. This can be attributed to its ionic nature as the electronegativity difference between H and F is large, leading to a more polarised bond. Well done. You could of also given examples of bond energies for HF and H2. Sf3014 (talk) 13:07, 21 May 2019 (BST)
Task 2
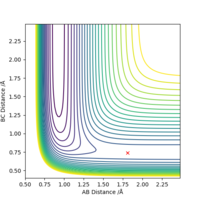
Locate the approximate position of the transition state.
The transition state H-H distance is 0.745 Å and the H-F distance is 1.808 Å. This can be shown using a contour plot, Fig.10, as there is no reaction pathway shown.
Good, but how did you get to this value? Also, it's good practice to define A, B and C in your image. Sf3014 (talk) 13:11, 21 May 2019 (BST)
Task 3
Report the activation energy for both reactions.
For the reaction H2 + F → HF + H, the transition state lies at -103.742 kcal.mol-1 and the reactants lie at -103.911 kcal.mol-1. Therefore, the activation energy of this reaction is 0.2 kcal.mol-1. For the reverse reaction, the reactants lie at -133.864 kcal.mol-1, so the activation energy is 30 kcal.mol-1. These energies were established using Energy vs Time plots for extremes of distances and the transition state.
Well done but next time show the plots that you stated. Sf3014 (talk) 13:13, 21 May 2019 (BST)
Task 4
In light of the fact that energy is conserved, discuss the mechanism of release of the reaction energy. Explain how this could be confirmed experimentally.
The mechanism is the conversion between translational and vibrational energy. Upon collision, translational is converted into vibrational energy. For the exothermic reaction, energy should be released whereas for the endothermic reaction, energy should be absorbed. Vibrational energy can be confirmed experimentally using infrared spectroscopy. Translational energy can be measured by using bomb calorimetry which measures kinetic energy using an isochoric process. Good but also show the conservation of energy through the necessary plots. How will IR and bomb calorimetry show you this process? More description is needed. Sf3014 (talk) 13:19, 21 May 2019 (BST)
By inputting rHH = 0.74, with a momentum pFH = -0.5, several values of pHH in the range -3 to 3 were explored. rHF was set to 2.3.
| pHH value | Level of Vibration of H-H bond | Reaction? |
|---|---|---|
| -3 | Very strong | No |
| -2.95 | Strong | No |
| -2.9 | Strong | No |
| -2.85 | Strong | No |
| -2.5 | Strong | No |
| -2 | Medium | Yes |
| -1.5 | Medium | Yes |
| -1 | Weak | Yes |
| -0.5 | Slight | Yes |
| 0 | Extremely slight | Yes |
| 0.5 | Slight | No |
| 1 | Weak | No |
| 1.5 | Medium | No |
| 2 | Medium | No |
| 2.5 | Strong | No |
| 2.85 | Strong | Yes |
| 2.9 | Strong | Yes |
| 2.95 | Strong | Yes |
| 3 | Strong | No |
(Table 2)
The reaction only appears to be successful for momentum values between 0 and -2 and between 2.85 and 2.95. This indicates there is no obvious trend between the momentum of the H-H bond and the success of the reaction. The success of the reaction between 2.85 and 2.95 violates Polanyi's rules.
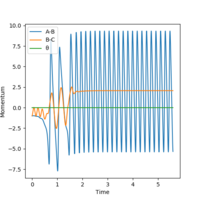

A set of initial conditions that results in a reactive trajectory for H2 + F → HF + H is as follows:
| H-H Distance | 0.74 Å |
| H-F Distance | 1.81 Å |
| H-H Momentum | -1 |
| H-F Momentum | -1 |
(Table 3)
Using the same initial position (H-H = 0.74 Å) but putting the H-F momentum = -0.8 and the H-H momentum = 0.1, we can see that the reaction is successful.
The second reactive trajectory for HF + H → H2 + F can be found by:
| H-H Distance | 2 Å |
| H-F Distance | 0.913128625 Å |
| H-H Momentum | -10 |
| H-F Momentum | -0.01 |
(Table 4)
The success of the trajectory can be seen on the Momentum vs Time graphs which shows constant oscillation, meaning that it has reached the end point. The second reactive trajectory involved a lot of momentum as the H-F bond is incredibly strong and a lot of energy is required to break it. Very good but your statement for table 2, how does it violate Polanyi's rules?. Sf3014 (talk) 13:24, 21 May 2019 (BST)
Task 5
Discuss how the distribution of energy between different modes (translation and vibration) affect the efficiency of the reaction, and how this is influenced by the position of the transition state.
Polanyi's empirical rules involve the effect of the transition state on the importance of different modes[2]. For an early transition state, such as in an exothermic reaction, translational energy is more important than vibrational energy in terms of the effect on the efficiency of the reaction. On the other hand, endothermic reactions, with a late transition state, place a greater importance on vibrational energy.
As F + H2 → HF + H is an exothermic reaction, its early transition state suggests greater importance of translational energy in affecting the efficiency of the reaction. This translational energy is reflected in the H-F momentum, whereas vibrational energy is reflected in the H-H momentum. The theory predicts that as H-F momentum increases, the reaction goes more to completion whereas increasing the H-H momentum has less of an effect. This is proven as if we increase the momentum of the H-H bond from -1 to -4, the reaction becomes unsuccessful, as seen in Fig.11. The lack of trend in the table above, Table 2, also perpetuates the agreement with Polanyi's rules as no trend is observed. The results between 2.85 and 2.95 violate Polanyi's rules, however. Whereas, as the reverse reaction is an endothermic reaction, if we decrease the momentum of the H-F bond from -1 to -0.5, the reaction becomes unsuccessful, as seen in Fig.12.


Very good observation and examples. Does Polanyi rules take into account for direction? because you stated that the positive momenta violates this rule. Sf3014 (talk) 13:36, 21 May 2019 (BST)
References
- ↑ 'Transition State Theory'. Britannica. Available from: https://www.britannica.com/science/transition-state-theory. Accessed 10 May 2019.
- ↑ Yeston J. Stretching the Polanyi Rules. Dec 2012. Science. 338(6113): 1397. Available from: https://science.sciencemag.org/content/338/6113/1397.2. Accessed 10 May 2019.

