MRD:hz7718
Exercise 1: H + H2 system
Grade: 3/5 - Some good features to this report. Some of your numerical estimates were a little off, and you failed to complete the final excercise. Other individual comments are provided throughout.
Transition state
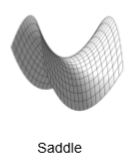
Mathematically, transition state is a saddle point which is on a graph of a function where slopes in orthogonal directions are zero.
For finding transition state on graph, the slopes of both r1 and r2 directions should be zero, which means δV/δr1 = 0 and δV/δr2 = 0. Also, if it is the maximum point in one direction, it should be minimum point in the orthogonal direction. In math, (δ2V/δr12)*(δ2V/δr22) - δ2V/(δr1*δr2) < 0.
A minimum stationary point means in both directions, it is the minimum point with zero gradients (δ2V/δx2 > 0 and (δ2V/δr12)*(δ2V/δr22) -δ2V/(δr1*δr2) > 0). But transition state is the minimum point in one direction but a maximum point in the other orthogonal direction.
Where do these directions lie on your PES though?
| saddle point on a graph | Minimum stationary point plot | Maximum stationary point plot |
|---|---|---|
 |
 |
 |
locating the transition state
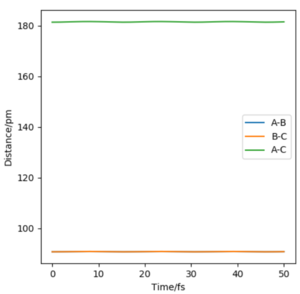
When the system is at transition state, the potential energies of both p1 and p2 are zero. And because all the three atoms are in equilibrium, the change of the energy is zero, too. It means that the gradients of potential energy surface is zero and the force acting on atoms is zero, which indicates there is no oscillation of the three atoms and r1 and r2 will keep constant. On the graph, r1 and r2 equal to 90.7pm, and two lines are almost perfectly straight without oscillating, which means it is(or close to) the transition state. So rts=90.7pm.
A good estimate for the TS, well done!
Trajectories from r1=rts+δ, r1=rts
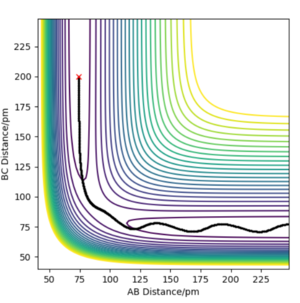
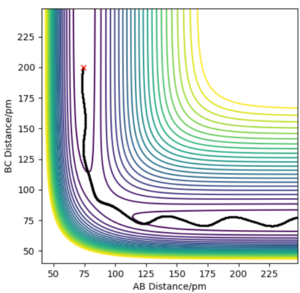
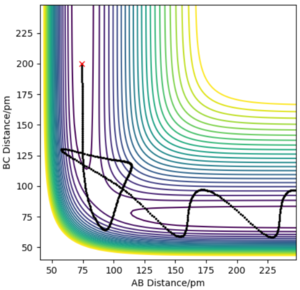
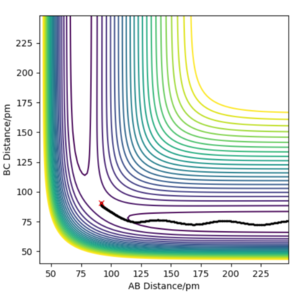
In MEP type graph, the trajectory follows the valley floor to H1 + H2-H3. But in the dynamic type graph, the shape of trajectory is wavy. This is because on mep, all atoms have zero kinetic energy(velocities and momenta are zero), which causes that B-C bond has no vibration. However, in dynamic type, kinetic energy is included in the system, so B-C bond will vibrate so the values of r2 will fluctuate.
What causes these momenta to be zero though? How does the code enforce this property?
| MEP graph, r1=91.7pm, r2=90.7pm, p1=p2=0 | Dynamic graph, r1=91.7pm, r2=90.7pm, p1=p2=0 |
|---|---|
 |
 |
Reactive and unreactive trajectories
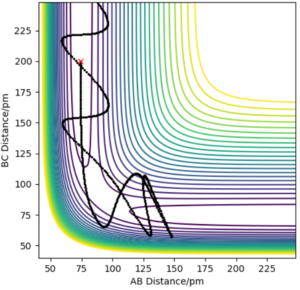
From the table above, we can know that even though the system has enough energy to react, it may still be unreactive.
Transition State Theory
In TST predictions, if the reactants with enough energy cross the transition state, it will never come back. However, the experimental results show the system can recross the transition state region and reform the reactants. SO, overall, the TST overestimates the reaction rate. And the TST has limitations: 1. High temperature, there are complicated vibrations which may lead the transition state far away from the saddle point of potential energy surface. 2. Quantum tunneling: Molecules and atoms can still tunnel across the barrier even with not enough energy. It will slightly underestimates the reaction rate. 1
A sensible explanation of the shortcomings of TST. Some really good ideas here. Well done!
Exercise 2: F-H-H system
PES inspection
| potential energy surface graph | Internuclear distance vs time plot |
|---|---|
 |
 |
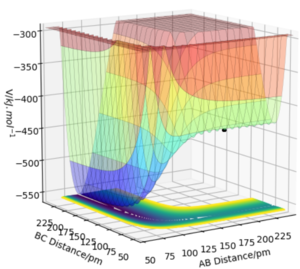
The potential energy surface graph show that the system H2 and F has higher potential energy than HF and H. It means H2 + F to HF + H reaction is exothermic and HF + H to H2 + F reaction is endothermic, which indicates that the bond strength of H-F is stronger than H-H.
So, from H2 + F to HF + H, the system needs to absorb energy from the environment, and from HF + H to H2 + F, the system releases energy to the environment.
When it comes to the transition state location, it can be analyzed by Hammond's postulate. 2 For example, in the reaction H2 + F to HF + H which is an exothermic reaction. The transition state is close to the structure of the reactants(so it is an early transition state). It means the distance between FA and HB is very large and the distance between HB and HC is smaller, which matches what potential energy surface graph shows. Unlikely the H-H-H system, the transition state of F-H-H system is not symmetric.
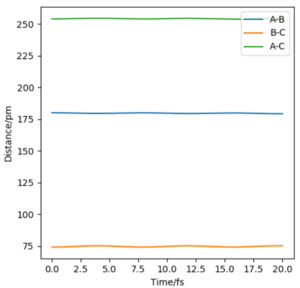
In the Internuclear distance vs time plot, FA-HB is 180pm and HB-HC is 74pm. And both lines are almost straight, which means all atoms only slightly vibrate. So, the change of potential energy is zero.
Then we can know the black point in potential energy surface graph is the transition state(where FA-HB=180pm, HB-HC=74pm and pH1=pH2=0).
A sensible estimation. How did you confirm that this was a saddle point, and not a potnetial energy minimum though?
Activation EnergyFor finding the actvition energy, the steps are extended to 3500. When FA-HB is 180pm and HB-HC is 74pm, we can find the Contour plot 1 shows that the transition state finally forms HF + H. So, from Graph 1, we can know the activation energy is 121.6 kJ/mol for the reaction HF + H to H2 + F.
| Contour Plot 1 | Graph 1 |
|---|---|
 |
 |
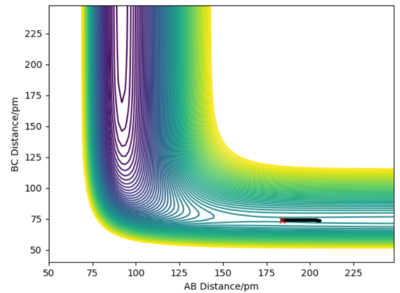
When FA-HB is 184pm and HB-HC is 74pm, the Contour plot 2 shows that the transition state finally forms H2 + F. So, from Graph 2, we can know the activation energy is 0.03 kJ/mol for the reaction H2 + F to HF + H.
A sensible estimate of the activation energy for FH+H. your estimate for F+H2 is a bit too low, likely because you've not let the reaction go to completion.
| Contour Plot 2 | Graph 2 |
|---|---|
 |
 |
Reaction dynamics
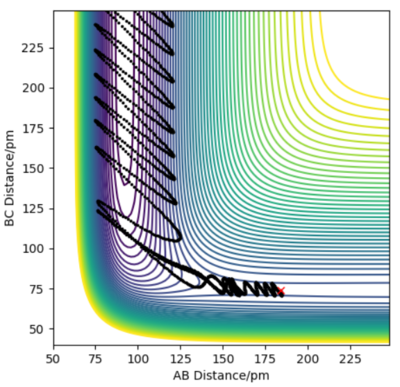
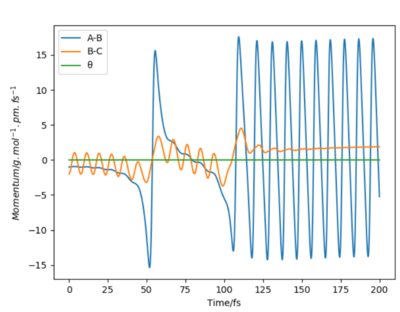
In reaction H2 + F to HF + H, FA-HB is 184pm and HB-HC is 74pm, p1=-1 and p2=-2. From the contour plot and animation, the product HF keeps vibrating and HC molecule moves away from HF. This is because the reaction is exothermic, the potential energy transfers to kinetic energy which includes vibrational energy and translational energy. However, from Momentum vs Time plot, it shows most of potential energy transfers to vibrational energy instead of translational energy because the HBA momentum fluctuates strongly but Hc-HB momentum keeps a relatviely low value.
The energy released mechanism can be confirmed by IR Spectroscopy. Because H-F vibration has dipole moment and it is active in IR. We can just measure the peak absorbance of H-F vibration at different time after reaction, if the absorbance is large, the vibrational energy of H-F is more. We can also use calorimetry to measure the heat produced by this reaction, and the heat energy measured is the change of kinetic energy of the products including vibrational energy and translational energy.
No, this is incorrect. Simply looking at the peak of an IR spectrum is not enough? How would we detect vibrationally excited states in IR spectroscopy?
| Contour Plot | Momentum vs Time |
|---|---|
 |
 |
Translational energy VS Vibrational Energy
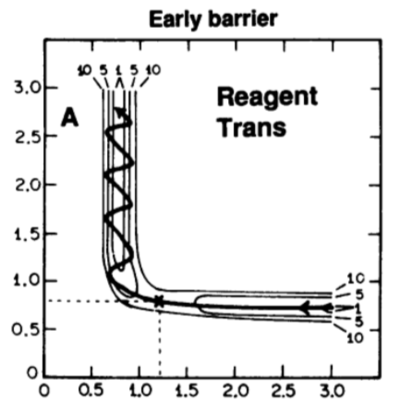
Graph 1 represents an exothermic reaction with an early transition state. And in exothermic reaction, translational energy can make the reaction more efficient because it can help the reactants pass the early transition state region. If most kinetic energy of reactants is vibrational energy, reactants cannot pass the early transition region in exothermic reaction.3
Graph 2 represent an endothermic reaction. Endothermic reaction has a late transition state. The reactants need more vibrational energy to cross the late transition state region. And translational energy cannot help reactants pass the late transition state.3
YOu need to provide some examples (i.e. trajectories for the F+h2 system) here to back up your assertion.
| Graph 1 | Graph 2 |
|---|---|
 |
 |
Reference
1.Veser, Götz. "Experimental and theoretical investigation of H2 oxidation in a high-temperature catalytic microreactor." Chemical Engineering Science 56.4 (2001): 1265-1273.
2.G.S. Hammond. A Correlation of Reaction Rates. J. Am. Chem. Soc. 1955, 77 (2): 334–338. doi:10.1021/ja01607a027.
3.J.C. Polanyi. Some Concepts in Reaction Dynamics. Science 1987, 236 (4802): 680-690. doi:10.1126/science.236.4802.680

