MRD:htl116 dynamic
Molecular Reaction Dynamics: Applications to Triatomic systems
Name: Lam Ho Tin Tovi (CID.: 01202655)
EXERCISE 1: H + H2 system
Dynamics from the transition state region
What value do the different components of the gradient of the potential energy surface have at a minimum and at a transition structure? Briefly explain how minima and transition structures can be distinguished using the curvature of the potential energy surface.
At the minimum of the potential energy surface, the gradient equals to 0 as it is defined as the turning point.
For the transition structure, it is defined as the saddle point[1] and has a gradient equals to 0. However, the two can be differentiated by the second derivative.
For the minimum point, the second derivative is positive as it is a local minimum.
For the transition structure, since the saddle point is defined as the point which is a maximum point on one axis and a minimum point on the other,
it has the maximum potential energy with respect to the reaction coordination axis but being the minimum point in the potential axis as reactions tend to follow the pathway with the lowest potential.
Hence, the second derivative of potential energy is negative with respect to reaction coordinate.
This part is good--Sw2711 (talk) 17:55, 17 May 2018 (BST)
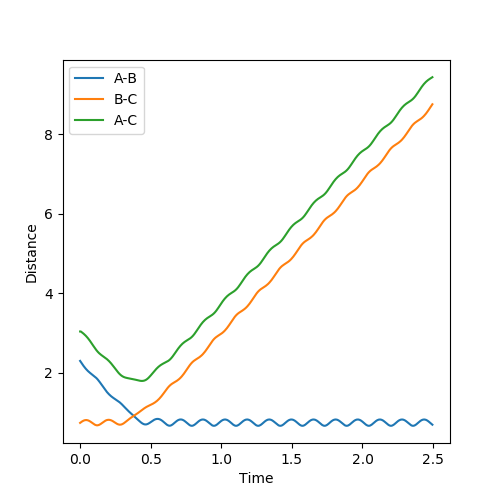
Report your best estimate of the transition state position (rts) and explain your reasoning illustrating it with a “Internuclear Distances vs Time” plot for a relevant trajectory.
 |
 |
|---|
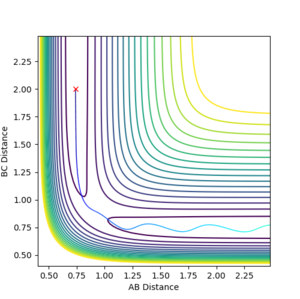
The initial conditions were setup as indicated in Fig1b. The intersection of the AB and BC curve in Fig.1a occurs at around time = 0.4 with a distance of r = 0.925.
 |
 |
|---|
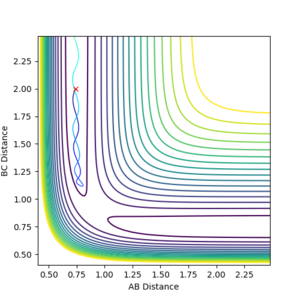
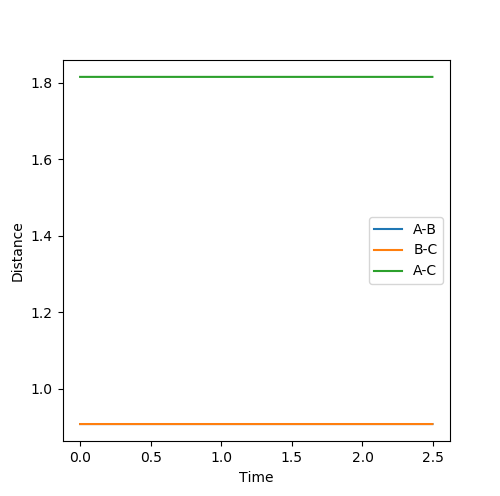
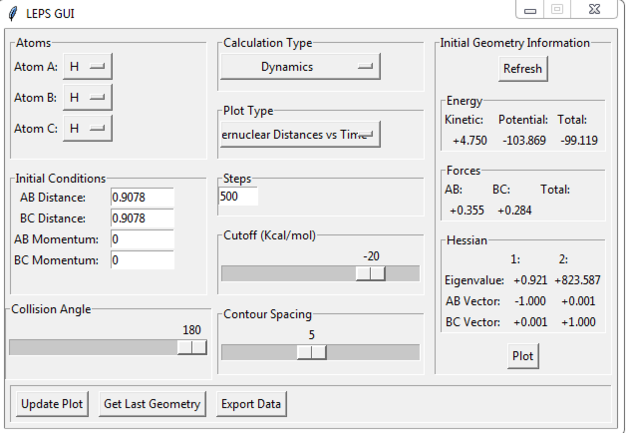
The transition state position was further verified by animation function and the true distance was found to be 0.9078 as indicated in fig 2b.
The reason is that at such distance the internuclear distance the internuclear distance remains constant over time fig 2a, suggesting minimal motion and remains stationary,
which is a characteristic of the transition state as the ‘stationary point’. This part is good--Sw2711 (talk) 17:57, 17 May 2018 (BST)
 |
 |
 |
|---|
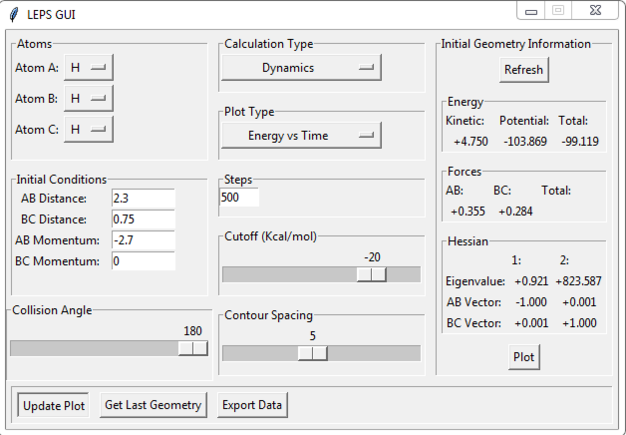
The energy over time was plotted to further verify the findings of the transition state distance. From fig 3a and fig 3b, it is observed the kinetic energy curve reaches a minimum while the potential energy curve reaches a maximum.
This is the characteristic of the transition state and the Law of Conservation of Energy was exhibited as the decrease in potential energy right after the transition state results in an increase in kinetic energy.
Comment on how the mep and the trajectory you just calculated differ.
 |
 |
|---|
 |
 |
|---|
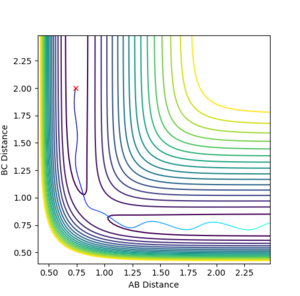
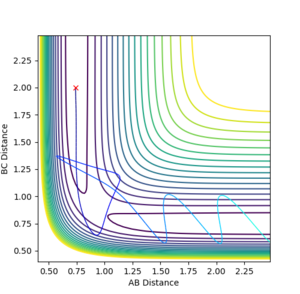
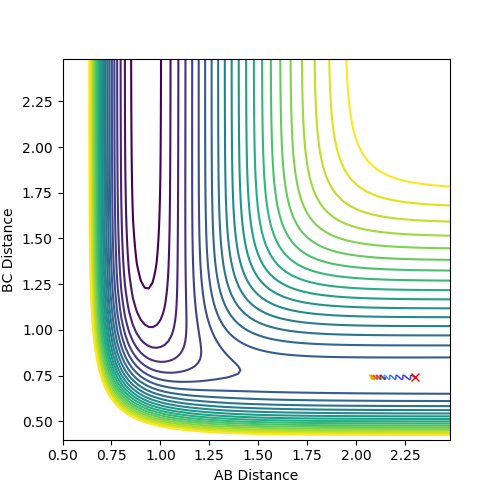
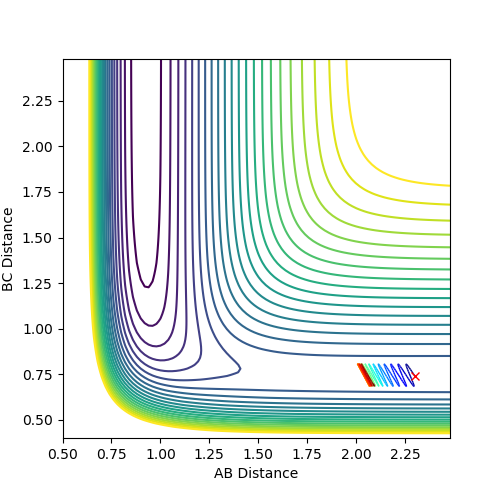
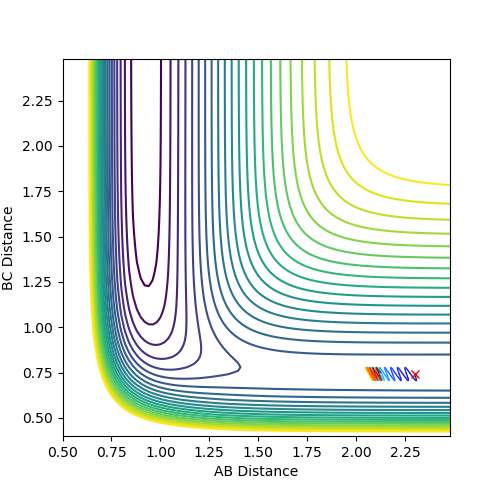
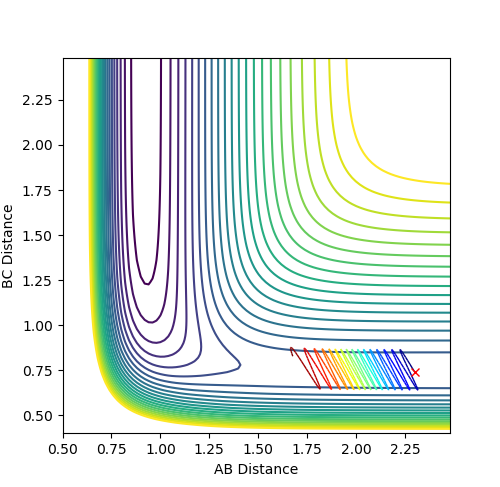
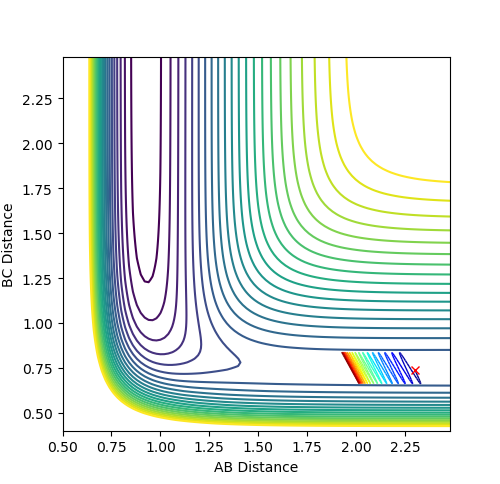
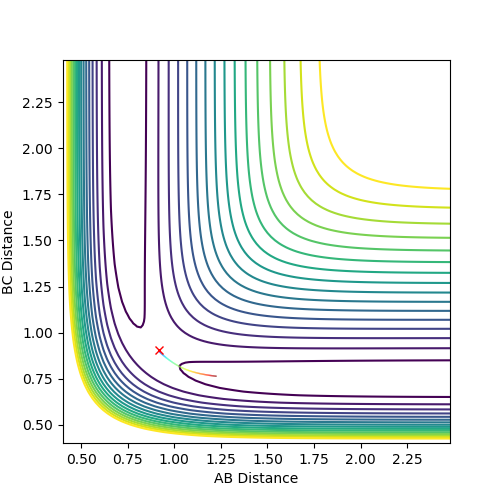
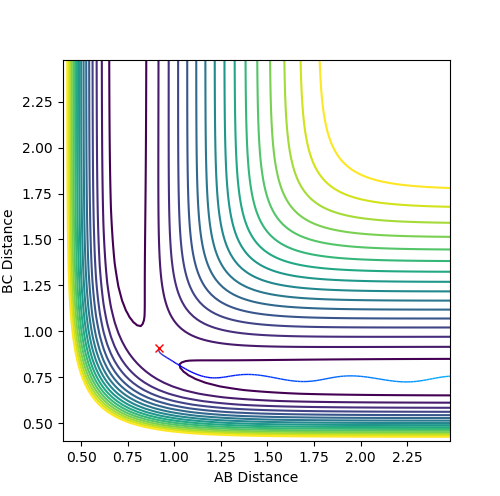
The main difference in MEP and dynamic calculation is the consideration of vibrational energy contribution.
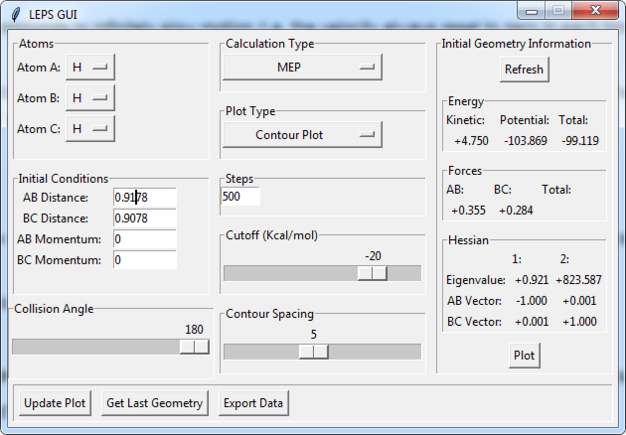
In MEP fig4a, vibrational energy is omitted hence the reaction of the atoms merely depend on the conversion of potential energy to kinetic energy. Since no vibrational energy is involved, the curve is smooth.
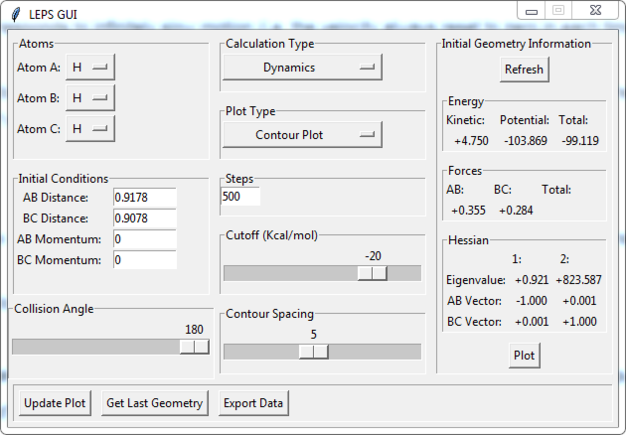
In dynamic fig 5a, vibration energy contribution is considered thus the atoms possess more energy than that in MEP.
A periodic oscillating behavior was observed, which is a characteristic of molecular vibrations due to thermal fluctuations. Good--Sw2711 (talk) 17:58, 17 May 2018 (BST)
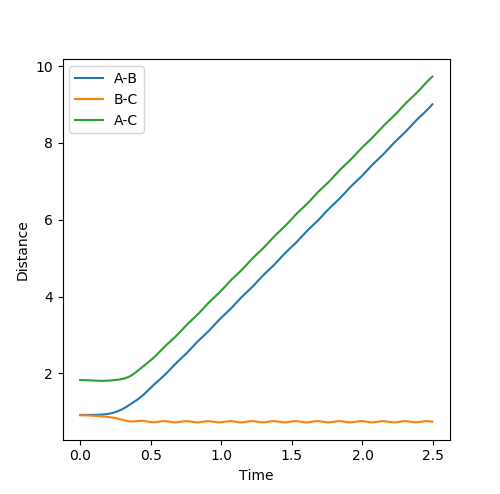
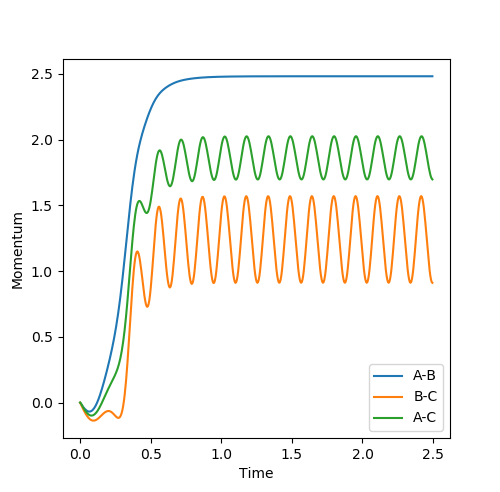
Look at the “Internuclear Distances vs Time” and “Internuclear Momenta vs Time”. Take note of the final values of the positions r1(t) r2(t) and the average momenta p1(t) p2(t) at large t.
 |
 |
|---|
At large t, r1 = 0.745 while r2 = 3.077. p1 = 1.245; p2 = 2.48.
What would change if we used the initial conditions r1 = rts and r2 = rts+0.01 instead?
The trajectory will be heading towards the other exit, but the shape of the trajectory curve will be the same.
Setup a calculation where the initial positions correspond to the final positions of the trajectory you calculated above, the same final momenta values but with their signs reversed. What do you observe?
By reversing the signs of the positions, the trajectory will go in opposite direction when compared to the previous simulation.
Reactive and unreactive trajectories
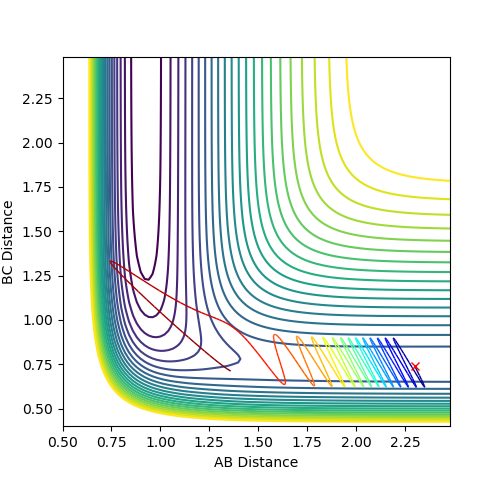
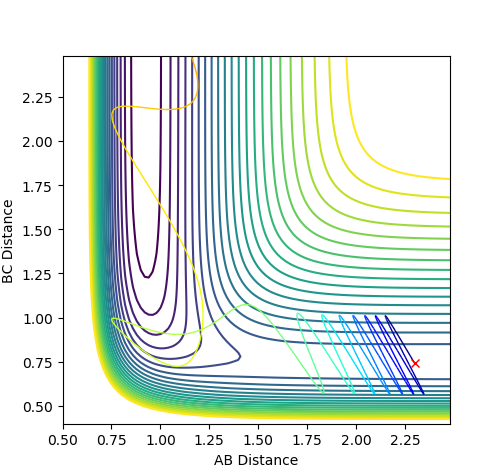
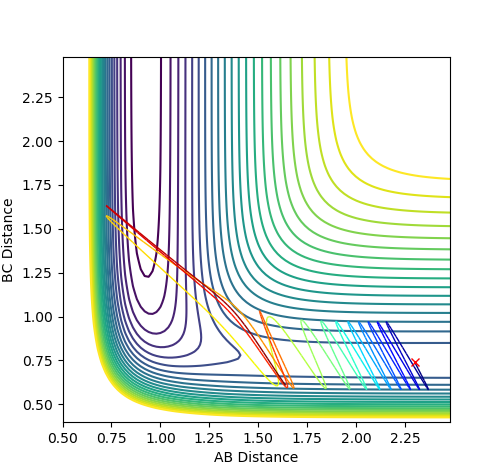
Complete the table by adding a column with the total energy, and another column reporting if the trajectory is reactive or unreactive. For each set of initial conditions, provide a plot of the trajectory and a small description for what happens along the trajectory.
Overall good. Just one little thing in the description, e.g. in case 4. the term we normally use is 're-cross TS', as we all know it is tricky to describe in bond breaking or reform near the TS--Sw2711 (talk) 18:01, 17 May 2018 (BST)
State what are the main assumptions of Transition State Theory. Given the results you have obtained, how will Transition State Theory predictions for reaction rate values compare with experimental values?
1.The Transition State theory assumes that reactants with sufficient energy will only pass through the transition state once and converted into the product.[2]
However, it was observed that the transition state can be ‘re-crossed’, even to multiple times.
Thus, it can be concluded that classical Transition State theory may break down in real reactions as justified by the last two simulations.
2.The classical Transition State theory assumes motions of particles comply with classical mechanics. However, in reality, the effect of energy quantisation and quantum tunneling exists but the theory did not take that into account.
3. The classical Transition State theory breaks down at high temperature.
It assumed that the reaction system will always pass through the lowest energy saddle point on the potential energy surface when converting from the reactant to product.
However, the assumption breaks down at high temperature since a high temperature leads to an increase in average energy and complexity of atomic motions. Effective collisions are possible even not at the lowest energy saddle point.
Good--Sw2711 (talk) 18:02, 17 May 2018 (BST)
EXERCISE 2: F - H - H system
PES inspection
Classify the F + H2 and H + HF reactions according to their energetics (endothermic or exothermic). How does this relate to the bond strength of the chemical species involved?
 |
 |
|---|
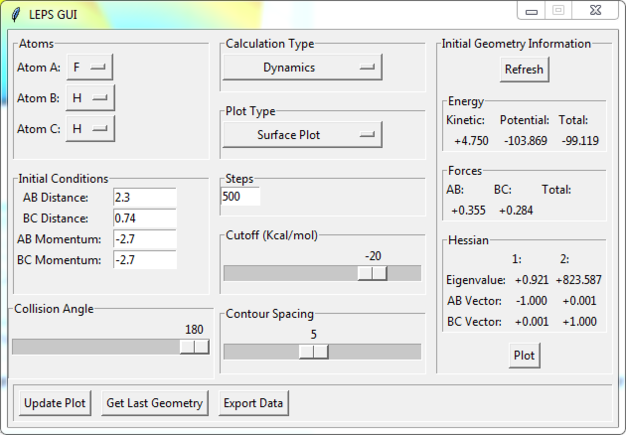
The reaction is exothermic as the product channel has a lower energy than the reaction channel as shown in fig 8a, large amount of energy is lost as heat.
It indicates that H-F is a stronger bond than H-H since it is more energetically stable with the heat loss as indicated. The finding is consistent with high electronegativity indicates a stronger bond.
 |
 |
|---|
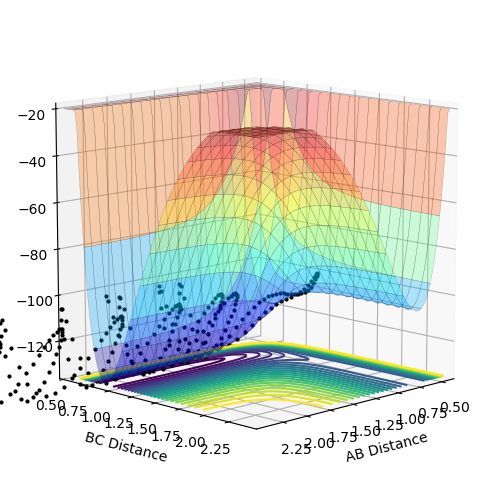
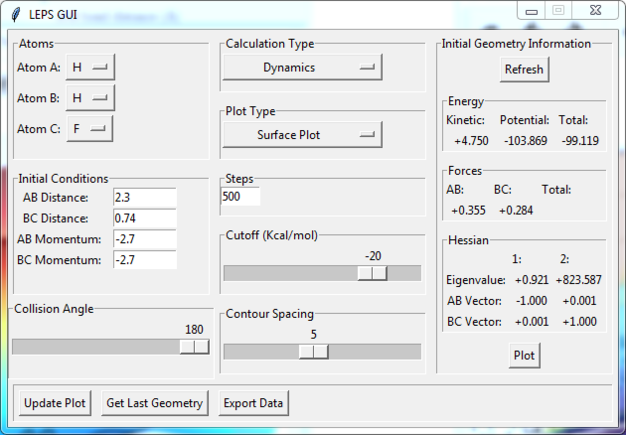
The reaction is endothermic as the product channel has a higher energy than the reactants channel as shown in fig 9a. Energy is required and absorbed by the system during the reaction.
This indicate H-H bond is weaker than H-F since is it energetically less stable with uptake of heat during the reaction as evidence.
This part is also good--Sw2711 (talk) 18:03, 17 May 2018 (BST)
Locate the approximate position of the transition state.
 |
 |
|---|
According to Hammond’s Postulate[3], the early transition state structure resembles that of the reactants for an exothermic reaction, while the late transition state structure resembles that of the products for an endothermic reaction.
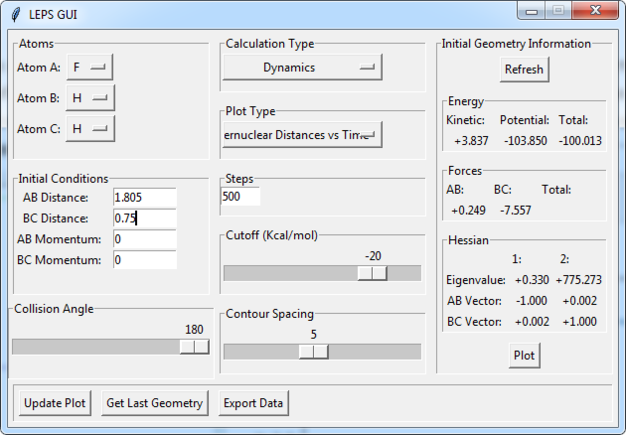
By observing the animation, the transition state position for the reaction is r1 (F-H) = 1.805; r2 (H-H) = 0.75.
The distance of the two bonds was plotted over time to verify the findings.
From the figure 10a, it can be observed the bond distances remains relatively constant which shows the characteristic of the transition state: atoms remain stationary over the saddle point. Good. I think it is still better to mention that you expect a straight line. But it is hard to get--Sw2711 (talk) 18:04, 17 May 2018 (BST)
Report the activation energy for both reactions.
The activation energy can be determined by finding the energy difference between the potential energy of the transition state and that of the reactants.
The potential energy of the transition state is -103.85 kcal.mol-1 as shown in the calculation.
For F + H-H, initial potential energy = -104.02 kcal.mol-1. Hence activation energy = -103.85 + 104.02 = 0.17 kcal.mol-1
For the reverse reaction, initial potential energy = -134.02 kcal.mol-1. Hence activation energy = -103.85 + 134.02 = 30.17 kcal.mol-1
Good, but as before. I'd like to see some evidence. Where did you get those figures from--Sw2711 (talk) 18:05, 17 May 2018 (BST)
Reaction dynamics
In light of the fact that energy is conserved, discuss the mechanism of release of the reaction energy. How could this be confirmed experimentally?
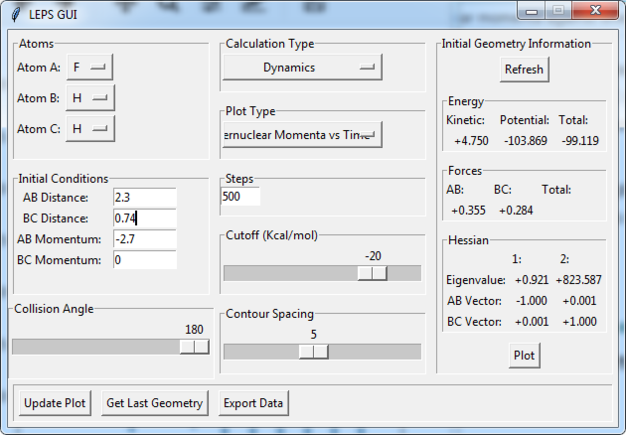
| Distance | Momentum | |
|---|---|---|
| F & H1 | 2.30 | -2.70 |
| H1 & H2 | 0.74 | 0 |
 |
 |
 |
|---|
The Law of Conservation of Energy[4] states that energy can neither be created nor destroyed, but can be transformed from one form to another.
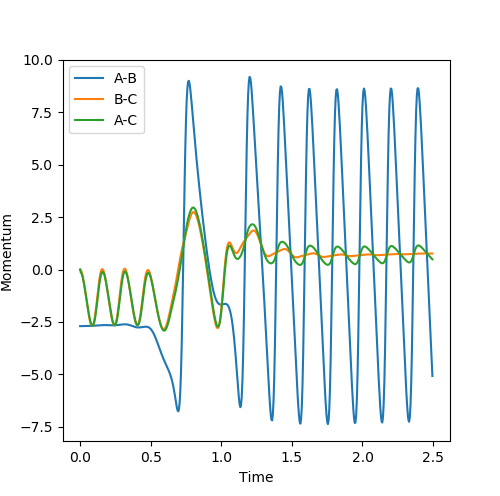
As shown in fig11a and fig 11b, before crossing the transition state position, AB bond distance decreases while BC bond oscillates, which is the indication of conversion of the atoms energy into translation and vibration respectively.
After crossing the transition state position, AB bond oscillates while BC bond distance increases, indicating the conversion of energy into vibration and translation respectively.
The can be confirmed experimentally by IR spectroscopy. First, the conversion of energy into vibration can be confirmed since the vibration of the molecule will result in a change in dipole moment, resulting in strong or medium peaks in IR spectrum.
Furthermore, the reactants and products can be differentiated by comparing their vibrational frequencies, which also verify the completion of the reaction. Yep, I agree with you. But this is a tricky thing if you want to confirm with IR. First of all, we want to check the change of energy (so, identifying the reactants and products is not really that helpful here). Secondly, what do you mean by 'strong or medium peaks'? Do you mean change in abundance? intensity? redshift or what? You need to be a bit more clear and careful when you say 'use IR' --Sw2711 (talk) 18:12, 17 May 2018 (BST)
Discuss how the distribution of energy between different modes (translation and vibration) affect the efficiency of the reaction, and how this is influenced by the position of the transition state.
Reaction 1: F + H-H -> H + H-F
| Contour Plot | |
|---|---|
| 0 | |
| 1 | |
| 2 | |
| 3 |
Polanyi’s rules states that late transition states are more efficiently promoted by vibrational energy, while early transition states are more efficiently promoted by translational energy.
Since the F + H-H -> H + H-F is a highly exothermic reaction, according to Hammond’s Postulate it will have an early transition state with a TS structure resembling that of the reactant.
According to Polanyi’s rules, the reaction is more efficiently promoted by translational energy than vibrational energy,
Nonetheless, while the vibrational energy PHH was varied but the translational energy was kept constant,
the reaction was not efficiently promoted hence all result in unreactive trajectories as shown in fig12a to fig 12g that either did not pass through the transition state or bounces back to its initial state.
| Plot |
|---|
However, a further increase of PHH to 4 leads to an unexpected reactive trajectory as shown in fig 13a. The exception is due to the large vibrational energy that lead to successful collision,
as is converted to translational energy as the BC moves away while AB being relatively constant after crossing the transition energy position.
Nonetheless, when PHH is further increased to 4.5, unreactive trajectory results since the atom bounces back to its initial state after crossing the transition state.
 |
 |
|---|
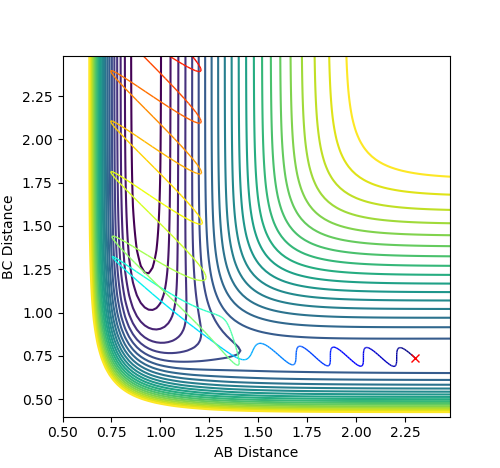
By applying Polyani’s rules hence increasing the translation energy of F-H and decreasing the vibration energy of H-H by increasing magnitude of AB momentum and decreasing BC momentum.
The reactive trajectory results.
Reaction 2: H + H-F -> H2 + F
 |
 |
|---|
 |
 |
|---|
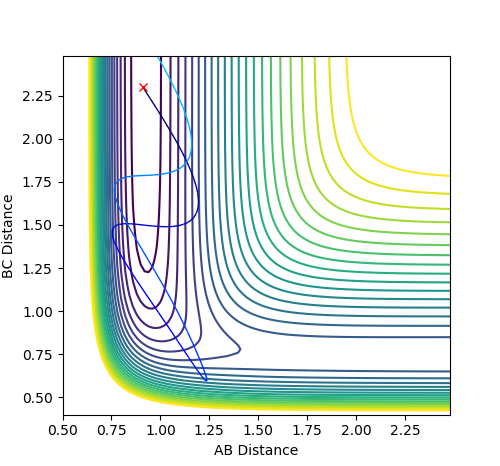
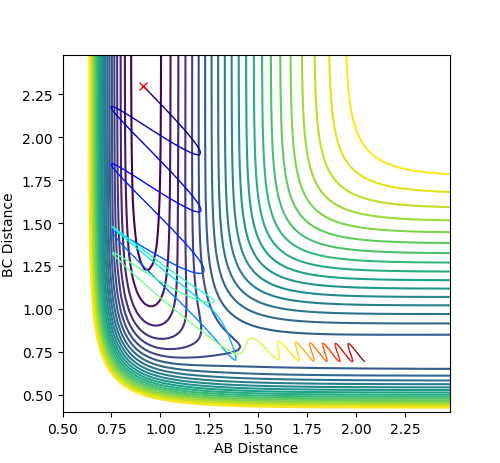
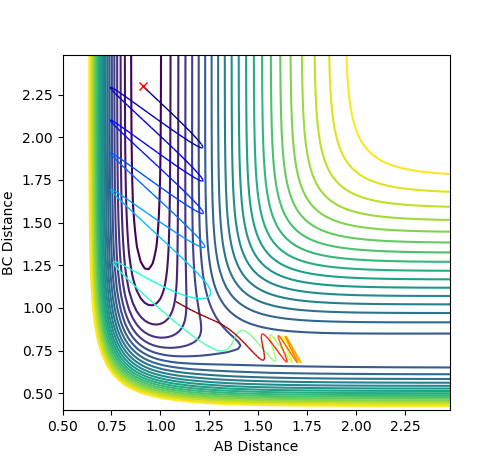
For the reversed reaction H + H-F -> H2 + F, it is a highly endothermic reaction with a late transition state.
Thus, according to Polanyi’s rules, the reaction is more efficiently promoted by vibrational energy than translational energy.
As shown, high values of vibrational energy (PFH) and low values of translational energy (PHH) lead to unreactive trajectories that the molecules bounces back after crossing the transitional state.
However, by complying Polanyi’s rules, low values of vibrational energy (PFH) and high values of translational energy (PHH) lead to reactive trajectories that the molecules bounces back after crossing the transitional state.
This part is good. I can see you have made a great effort to investigate this. Something you need to be aware when you apply Polanyi’s Rule is that, ‘the reaction is more efficiently promoted by vibrational energy than translational energy’, the keyword is ‘efficient’. What it really means is that given total energy constant, what would be the best distribution of different types of energy to make the reaction effective (what’s the proportion of vibrational energy and what is the proportion of translational energy). So when you only increases or decreases one value in your momentum, you actually added more total energy into the whole system. This makes your comparison isn’t that fair anymore. In fact, I have tried your system (I assume your AB distance is 0.92 and BC is 2.3). For your figure.15c and 15d, I kept your PFH = 6 and 7. But instead of keeping both PHH = -1.7, I decreased Fig15d. PHH to -1.0, which the reaction is reactive again. You can do the same by increasing PFH to 8 and keep decreasing the PHH to 0.5, it is a reactive trajectory again. Now you go back and check the total energy for all of these systems. You can see the Fig 15d. system, even though it is highest in total energy, it is not reactive, i.e. not very efficient. --Sw2711 (talk) 11:23, 18 May 2018 (BST)
Another thing I’d like to point out is that if you think one momentum is equivalent to vibrational energy and the other momentum is equivalent to translational energy, this is not true. When you add the momentum into the system, you are just adding the kinetic energy. But whether this kinetic energy goes to translational or vibrational energy, you have some control, but not all of them. The best way to read the vibrational energy is to see how many contour lines the trajectory has passed (i.e. how far away it is from the minimum energy path). Therefore, changing the momentum of the molecule is not the only way to change the vibrational energy, you can also change your starting point (i.e. the molecule bond length). --Sw2711 (talk) 11:23, 18 May 2018 (BST) I hope that makes sense. --Sw2711 (talk) 11:23, 18 May 2018 (BST)

