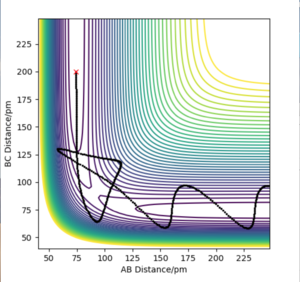
MRD:hs4018 mrd
Molecular Reaction Dynamics: Applications to Triatomic systems
Exercise 1: A H2 + H System
On a potential energy surface diagram, how is the transition state mathematically defined? How can the transition state be identified, and how can it be distinguished from a local minimum of the potential energy surface?
A transition state of a reaction is defined as a maximum on the minimum energy pathway (MEP) from the reactants to the products. The transition state does not represent an isolatable molecule but constitutes the bonds breaking and forming from the reactants to products. In mathematical terms, the transition state has a gradient of zero at this point and is defined by: ∂V(ri)/∂ri=0. Where V is the potential energy and r is the distance between atoms. The transition state on a potential energy surface(PES) can be described as a saddle point which means that in one direction in space the transition state is maxima, where the second derivative is negative, and also in an orthogonal direction the transition state is a minima, where the second derivative is positive[1]. The saddle point is located between two minima and can be distinguished from them using the hessian matrix. The hessian matrix takes the partial second derivatives and outputs eigenvalues. From these eigenvalues the saddle point can be distinguished from local minima.
The different approaches for defining a TS could have been separated better from each other, and would have benefitted from showing the relevant equations. Nevertheless, not wrong. Fdp18 (talk) 12:33, 24 May 2020 (BST)
Report your best estimate of the transition state position (rts) and explain your reasoning illustrating it with a “Internuclear Distances vs Time” plot for a relevant trajectory.

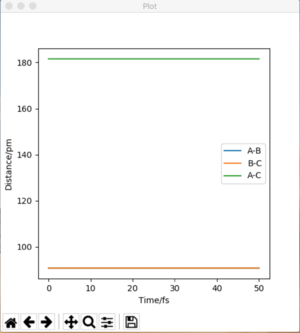
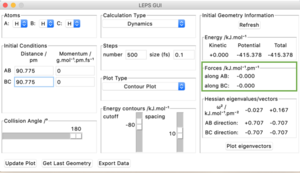
The H2 + H system gives a transition state where Rab = Rbc because of the fact that the system is symmetrical. If a trajectory is started at this ridge then trajectory will oscillate at this ridge and never fall of due to the fact that at directions at right angles to this ridge the gradient is 0. From this rts= 90.775 pm. We can confirm this value from the forces along the bonds as well as from a internuclear distances vs time plot. At the transition state the force should equal 0 and this is the case at 90.775 pm. The internuclear distances vs time plot displays two flat lines which means that the distance between the atoms is not changing which proves that the transition state lies at this value of rts.
I see that you obtained a very good value for Rts, and were also able to demonstrate that it is a good value. However, I'm missing some intermediate steps - What would I need to do to arrive at this result? Think of it like describing a synthesis or a recipe - you need to provide enough steps for the reader to be able to reproduce your results. Fdp18 (talk) 12:36, 24 May 2020 (BST)
Comment on how the mep and the trajectory you just calculated differ.
The minimum energy pathway (MEP) is a specialised trajectory that represents infinitely slow motion and can only be run once the transition state is located You can easily check this - the MEP can be run from any point you like. Fdp18 (talk) 12:37, 24 May 2020 (BST) . In both figures the initial conditions are rab= 90.775 nm, rbc =91.775 nm and pab=pbc= 0 g.mol-1.pm.fs-1. The MEP calculation figure is useful for characterising the reaction but is not a good realistic method of analysis of motion of the H atoms as it does not consider that the atoms have mass and their motion in the gas phase is inertial. The dynamics calculation method figure is a much more accurate method of representing the motion of the H atoms.
I cannot see that you actually worked with the two methods. I'm sure you did it, but you also need to show it - two contour plots with the same starting conditions, one MEP and one dynamics, would be enough. Fdp18 (talk) 12:38, 24 May 2020 (BST)
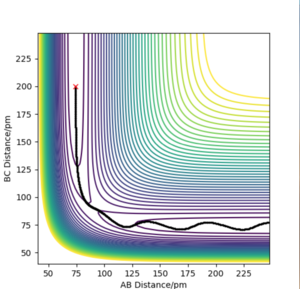
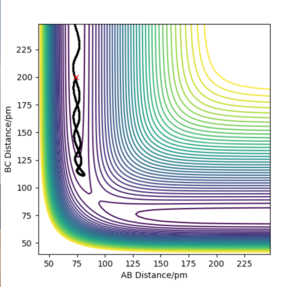
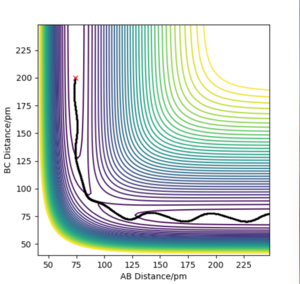
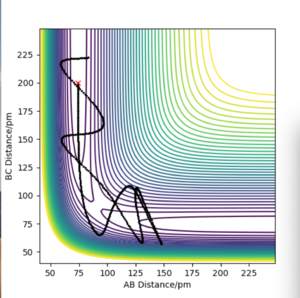
Complete the table by adding the total energy, whether the trajectory is reactive or unreactive, and provide a plot of the trajectory and a small description for what happens along the trajectory. What can you conclude from the table?
For all trajectories in the table below A-B represents the H2 molecule and C the H atom at the beginning of the reaction.
From this table we can clearly see the effects of increasing the momenta and thus the kinetic energy of the system has on the reaction. Initially is was hypothesised that the higher the momenta the easier it would be to overcome the activation energy barrier and form products. However, this is not supported by the data in the table as the second and fourth row show no product formation even at higher momentum. Overall, this data suggests that the trajectory is not solely on the momenta/kinetic energy but on other variables such as orientation.
Correct and concise, good descriptions. Fdp18 (talk) 12:40, 24 May 2020 (BST)
Given the results you have obtained, how will Transition State Theory predictions for reaction rate values compare with experimental values?
The transition state theory is a classical theory is used for reaction rate analysis. This theory makes a variety of assumptions such as:
- If the system passes the TS then the system will go to the products and cannot return to the reactants. -Quantum tunnelling is negligible.
Where did you take these assumptions from? Are there others? Fdp18 (talk) 12:42, 24 May 2020 (BST)
From these assumptions we can see that the transition state theory predictions will be higher than the experimental values[2].
How would quantum tunneling affect the reaction rate? This part is a bit too brief, I cannot follow your reasoning. Fdp18 (talk) 12:42, 24 May 2020 (BST)
Exercise 2: F - H - H system
By inspecting the potential energy surfaces, classify the F + H2 and H + HF reactions according to their energetics (endothermic or exothermic). How does this relate to the bond strength of the chemical species involved?
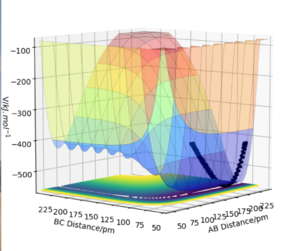

The potential energy surface plot for the HF + H system illustrates that this specific reaction is endothermic. This is due to the fact that the reactants are lower in energy compared to the products which means that the system requires additional energy to go from the lower energy valley of the reactants to the higher energy valley of the products. The H-F bond requires a lot of energy to break and the H-H bond is weaker than the H-H bond hence an endothermic reaction.
How do you know which bond is weak and which is strong? do you have a reference? Fdp18 (talk) 12:43, 24 May 2020 (BST)
The potential energy surface plot for the H2 + F system illustrates that this specific reaction is endothermic. This is due to the fact that the reactants are higher in energy compared to the products which means that the system prefers to go from the higher energy valley of the reactants to the lower energy valley of the products. In this case the H-H bond requires less energy to break than the energy required to form the H-F bond which gives the exothermic reaction.
There is an obvious copy&paste error in this paragraph. Fdp18 (talk) 12:44, 24 May 2020 (BST)
Locate the approximate position of the transition state and the activation energies.

While the result is correct, it is not possible for me to reproduce your results - see one of the previous comments. This is important: You need to show the work you did! This will apply to pretty much your whole career. Fdp18 (talk) 12:46, 24 May 2020 (BST)
For the H2 + F system the transition state was located at rH-H= 74.487 pm and rF-H= 181.100 pm. The activation energy was found by finding the potential energy using MEP calculation type at the transition state and then by finding the reactant potential energy minima of the reactants and then finding the difference. The activation energy for this is 1.066 kJ.mol-1. A energy plot for this is not shown as the difference is too small to see.
 |
 |
For the HF + H system the transition state was located by a trial and error method until the forces along AB and BC were 0 kg.mol-1.pm-1. From this the transition state was located at rH-H= 74.490 pm and rF-H= 181.000 pm. The activation energy for this system is 121.708 kJ.mol-1.
The Activation energy is a bit off, albeit semi-quantitatively correct. Again - how did you arrive there? Did you notice that those two TS are the same? Is is, after all, the exact same PES the nuclei are moving in... Fdp18 (talk) 12:48, 24 May 2020 (BST)
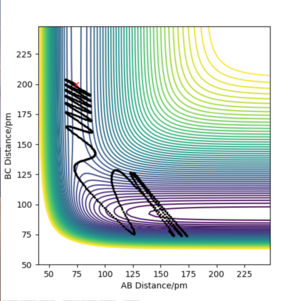
Identify a set of initial conditions that results in a reactive trajectory for the F + H2, and look at the “Animation” and “Momenta vs Time”. In light of the fact that energy is conserved, discuss the mechanism of release of the reaction energy. Explain how this could be confirmed experimentally.
 |
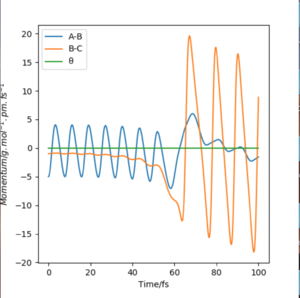 |
The initial conditions to find the reactive trajectory were AB= 74 pm, BC = 200 pm, p1= -5g.mol-1.pm.fs-1 and p2 = -1 g.mol-1.pm.fs-1. Upon looking at the animation and momentum vs time plots it can be confirmed that this trajectory is reactive. From the contour plot we can see the F atom(C) approaching oscillatory H-H bond (AB) containing vibrational energy. From the momenta vs time plot we can see the mechanism of release of the reaction energy, as to begin with B-C contains no vibrational energy(horizontal line) and A-B contains vibrational energy (oscillating). Once the two species collide and the H-H bond breaks and the H-F bond forms a larger oscillatory function is seen on the plot which suggests H-F contains a larger amount of energy.
Experimentally this reaction can be confirmed from the use of IR spectroscopy. For a molecule to be IR active it needs to have a dipole moment and in this specific reaction the H2 reactant is IR inactive and the HF product is IR active. So if the reaction does not proceed no vibrational bands caused by vibration transitions will be observed whereas if the reaction does proceed then we do expect to observe vibrational bands.
How could you measure/observe the released energy? Fdp18 (talk) 12:50, 24 May 2020 (BST)
Discuss how the distribution of energy between different modes (translation and vibration) affect the efficiency of the reaction, and how this is influenced by the position of the transition state.
Polanyi's rules allows us to establish the effect of the translational and vibrational modes of energy on the efficiency of the reaction. For the exothermic reactions it can be seen that the translational energy has a larger effect than vibrational energy. Whereas in endothermic reactions vibrational energy has a larger effect than the translational energy. [3]
This part is, again, too brief. What did you do to arrive at this conclusion? Did you try different starting geometries and momenta? What did you observe, and what is the reasoning that led you to arrive at your conclusion? Some contour plots for the different cases (different starting geometries for the two reactions, different ratios of vibration and translation, different total momenta, successful and unsuccessful trajectories...) would be good here. Fdp18 (talk) 12:52, 24 May 2020 (BST)
References
- ↑ 1.0 1.1 J. Chem. Educ. 1988, 65, 8, 665 Publication Date:August 1, 1988 https://doi.org/10.1021/ed065p665
- ↑ 2.0 2.1 . Phys. Chem. 1979, 83, 1, 108–113 Publication Date:January 1, 1979 https://doi.org/10.1021/j100464a018.
- ↑ 3.0 3.1 J. Phys. Chem. Lett. 2012, 3, 23, 3416–3419 Publication Date:November 6, 2012 https://doi.org/10.1021/jz301649w.

