MRD:hrc115
H plus H2 System
Dynamics from the Transition State Region:
The saddle point of the potential energy surface- also known to us as the transition state- is the highest point on the lowest energy reaction path. This point can be found by considering the derivatives of the potential energy of the system with respect to the bond distances r1 (AB) and r2 (BC). Where both of these gradients converge to 0, the transition state will be found.
Locating the Transition State:
To calculate the transition state, both momenta values were set to 0 and, as this reaction is symmetrical, the two bond distances were kept equal throughout.
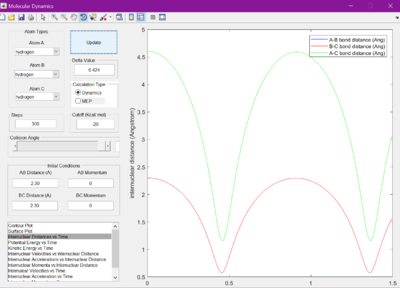
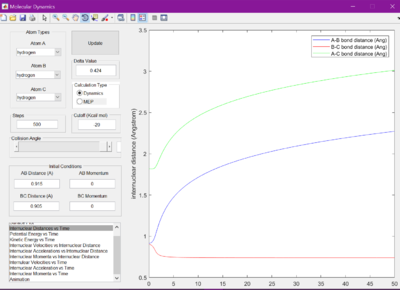
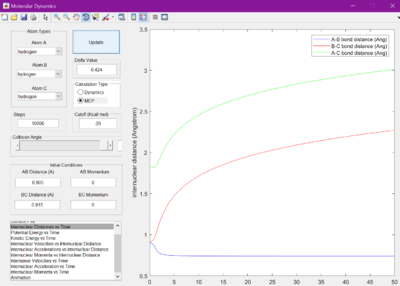
Each bond distance was set to 2.30 A. Figure 1 was observed when the Internuclear distance versus time was looked at. A gap of roughly 1 A was seen between the A-C and B-C bond distances.

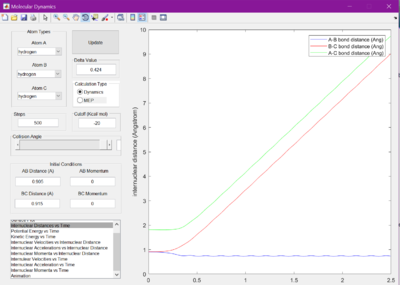
The internuclear distances were therefore then set to 1 where it was seen that the lines from the previous figure became much flatter. It was found they were flattest when the internuclear distances were set to 0.905 A.

When set to this value, the surface plot was seen to show the reaction pathway as only a small dot, which is the transition state. Therefore, the transition state is found at 0.905 A.
Calculating the Reaction Path:
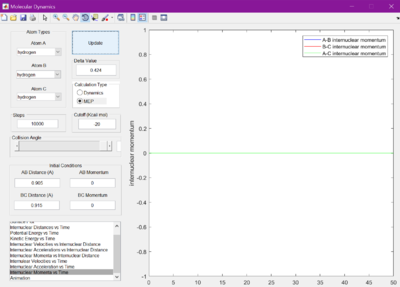
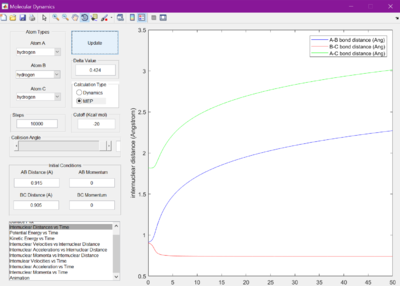
The minimum energy pathway (MEP) was investigated by adding 0.01 to r1 and keeping r2 as before at 0.905 A, so that the reaction would no longer sit at the transition state, but roll one way or the other. The surface plot and internuclear momentum vs time graphs are shown for both the normal dynamic reaction, and the MEP reaction
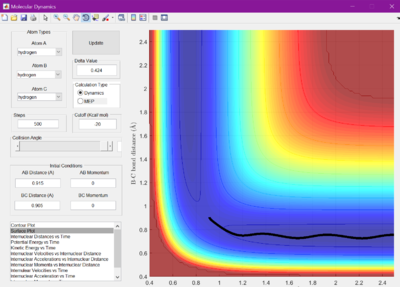
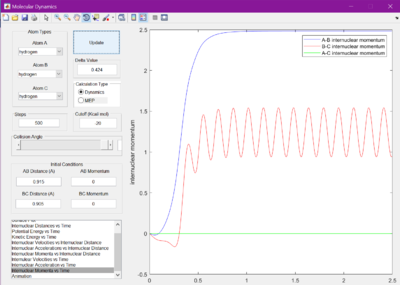

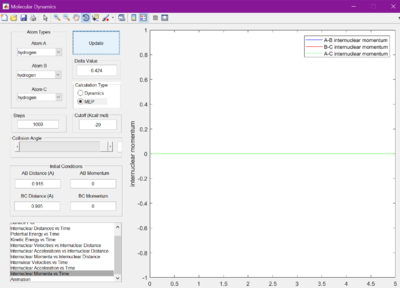
As seen from the graphs, the MEP halts any internuclear vibrations. However, this is not a realistic view of the molecules.
The internuclear distance vs time graphs were then looked at alongside the internuclear momenta vs time graphs for the previous conditions, and also adding 0.01 to r2 and keeping r1 at 0.905. No differences were noted apart from it was different bonds vibrating and changing length, highlighting the symmetry of the reaction.



Reactive and Unreactive Trajectories
We know that for reactions where r1 = 0.74 and r2 = 2.0, -1.5 < p1 <-0.8, and p2 = -2.5, the reaction will go to completion and will pass the transition state.These paramaters were changed to investigate whether the reaction would work or not under certain conditions. The internuclear distances were kept at 0.74 A and 2.0 A for r1 and r2 respectively. The momenta were changed as shown by the table below for each test, as well if whether it was reactive or unreactive.
| p1 | p2 | reactive or unreactive |
|---|---|---|
| -1.25 | -2.5 | reactive |
| -1.5 | -2.0 | unreactive |
| -1.5 | -2.5 | reactive |
| -2.5 | -5.0 | unreactive |
| -2.5 | -5.2 | reactive |
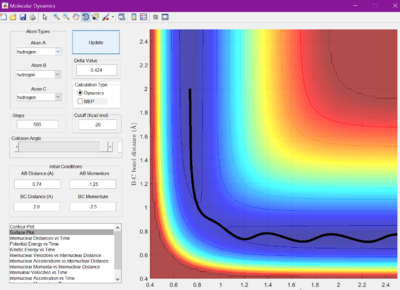
The reaction crosses the energy barrier and goes to completion.
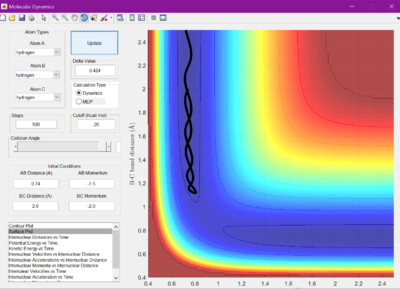
The reaction does not have enough energy to overcome the energy barrier, so it remains as the reactants.
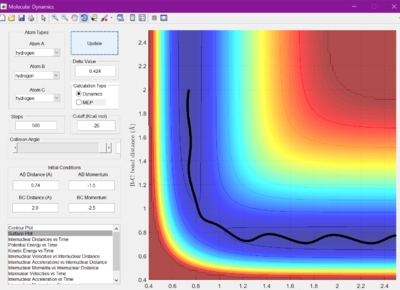
The reaction crosses the energy barrier and goes to completion.

The reaction crosses the energy barrier, but it rebounds and goes back to reactants.
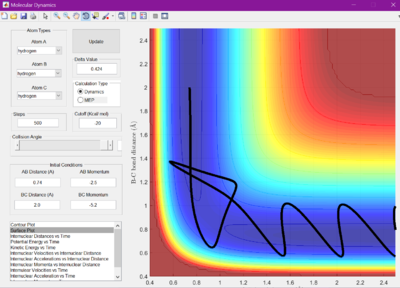
The reaction crosses the energy barrier, reverts back to the reactants, but then recrosses and procedes to form the products.
Transition State Theory
Put simply, transition state theory is the theory that reactants form an activated complex at the transition state (saddle point) and then decay into products. However, as shown above, the reactant path does not always cross through the transition state, but may take a higher energy path. This means that if only the reactions that pass directly through the saddle point are considered, many reactions which do still go to completion go unacounted for. This means the rate constant may be higher than sometimes thought. Another important point demonstrated above to be considered, is the fact that reaction trajectorys can recross the transition state. Even if they have enough energy to turn into the products, they can still decay back to reactants, meaning less reactions may be being succesful than thought.
F-H-H system
Potential Energy Surface Inspection
The transition states for the reactions F + H2 and H + HF were found. First of all, it was considered whether each reaction was exothermic or endothermic. As the reaction of F + H2 results in the formation of the strong F-H bond- which is stronger than the bond found in diatomic hydrogen- it is exothermic. It follows, that the reverse reaction, H + HF, is endothermic as a weaker bond is formed.
This can be seen when looking at the surface plots- if initial conditions were changed so that the two reactions went to completion, it would be seen that in F + H2 there would be a decrease in energy, and H + HF would have an increase.
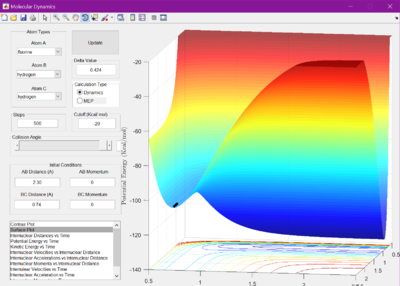

As this reaction is not symmetrical, and so therefore bond lengths r1 and r2 will not be the same, the determination of the bond lengths found at the transition state are more difficult to predict. Therefore, Hammonds postulate is considered. This states that the transition state will be found resembling whichever of the reactants and products it is closer to in energy. This therefore means that for exothermic reactions the transition state will more resemble the reactants, and endothermic the products.
Using this information and the graph showing internuclear distance versus time, the transition states were found. For F + H2, r1 was found to be 1.81250 A, and r2 to be 0.74220 A. For H + HF, it was determined that r1 is 0.72005 A, and r2 is 1.812500 A.
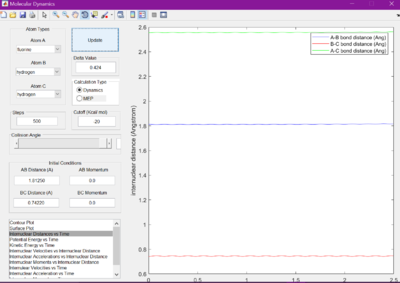
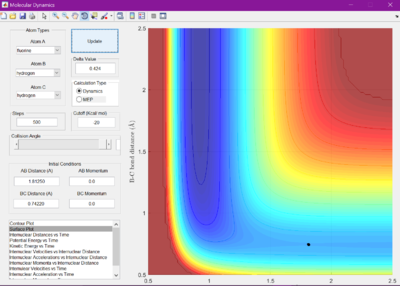
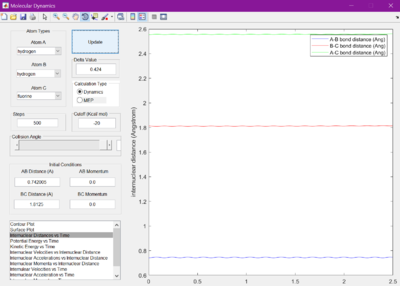
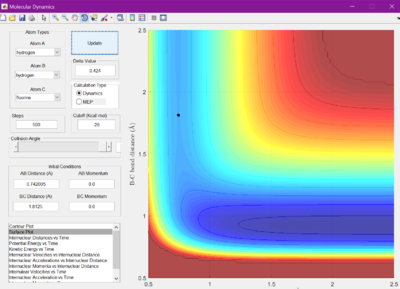
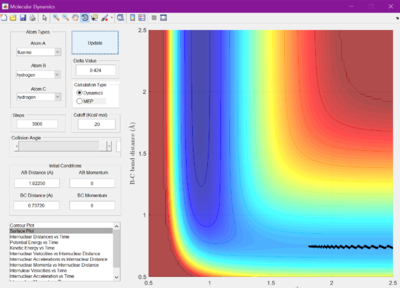
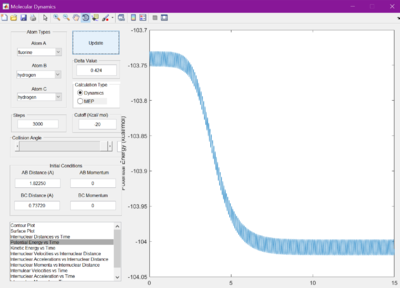
The activation energies were then calculated by changing the bond lengths r1 and r2 so that trajectory would lead back towards the reactants. The change in potential energy is equal to the activation energies. F + H2 has an activation energy of 0.3 kcal/mol, and H + HF has an activation energy of 30.4 kcal/mol.
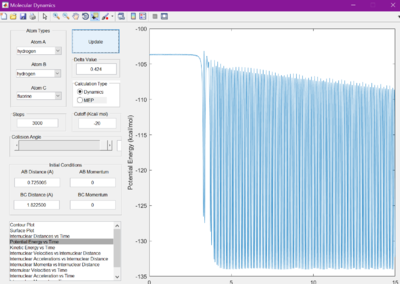

Reaction Dynamics
Initial conditions were selected that were found to drive the reaction of F + H2 to completion. From trial and error, conditions of r1 = 2.40 A, p1 = -2.0, r2 = 0.745 A, and p2 = -5.1.
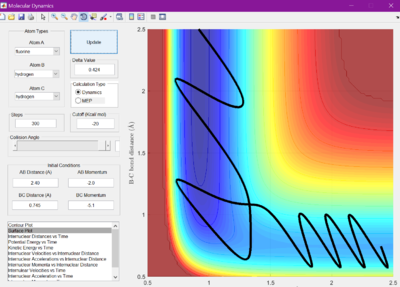

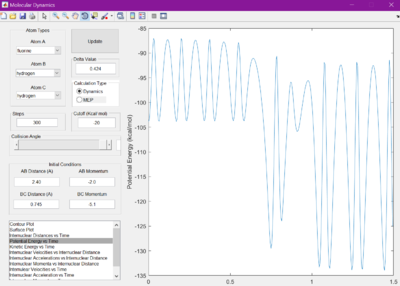
It was hypothesised that the release of energy from the reaction would be given out in the form of heat. This is confirmed by studying the potential energy vs time and kinetic energy vs time graphs. They appear to be mirror images of each other, showing there is always constant energy in the system. Since kinetic energy can produce heat, due to the vibrations of the molecules, this hypothesis is correct. This can be experimentally confirmed by measuring the change in temperature of a reaction, using the knowledge of the systems heat capactiy.
A new calculation was set up where rHH = 0.74, rHF = 2.40, pHH = -0.5, and -3< pHF <3. Values close to these limits were tested.
It was found that when pHF was close to -3, the reactions passed the transition state but then crossed to reform the products. When pHF was colse to 3, the reaction trajectory did not pass the transition state at all.
When the conditions were changed so that pHF = -0.8 and pHH =0.1, the reactants vibrated, but did nto cross the transition state.
Despite this, it can be seen that in F + H2 has vibrational motion before crossing the transition state, which then is converted into translational motion.
