MRD:hnt14
Molecular Reaction Dynamics
Exercise 1: H + H2 System
Question 1:What value does the total gradient of the potential energy surface have at a minimum and at a transition structure? Briefly explain how minima and transition structures can be distinguished using the curvature of the potential energy surface.
Answer 1:The value of the total gradient of the potential energy surface at a minimum and at a transition state which is the maximum will be zero in both cases. As opposed to the minima, the transition state occurs at the maximum of the curve. The maximum and minimum points both correspond to the point where the gradient (first derivative) of the curve is equal to zero. By taking the second derivative, the stationary points can be determined. The maximum (transition state) will have a negative stationary point, whereas that of the minimum will be positive, making them distinguishable.
(Fv611 (talk) 12:08, 25 May 2017 (BST) The TS is the maximum in the reaction coordinate, but it is also a saddle point, as it is a minimum in all other directions.) Question 2:Report your best estimate of the transition state position (rts) and explain your reasoning illustrating it with a “Internuclear Distances vs Time” screenshot for a relevant trajectory.
Answer 2:When r1=r2=1.4 Å, it was observed using the surface plot that the minimum of the trajectory which corresponds to the transition state gave an approximate transition state position (rts)=0.9 Å(refer to Figure 1). This was also true when r1=r2=2.1 Å (refer to Figure 2) , suggesting that the rts value was around 0.9 Å. At the transition state, the internuclear distance will be constant and oscillation will be minimal on the internuclear distance vs time plot, so it was possible to test the proposed rts value using this plot. As observed in Figure 3, this was indeed the case when rts= 0.907 Å, indicating this could be where the transition state occurs.
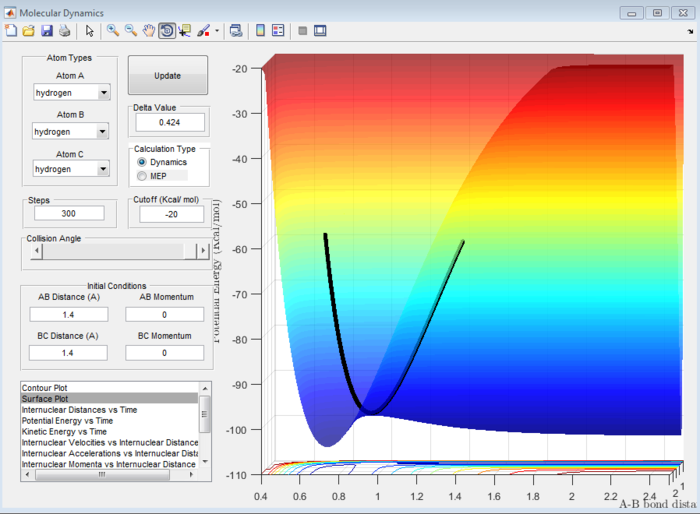
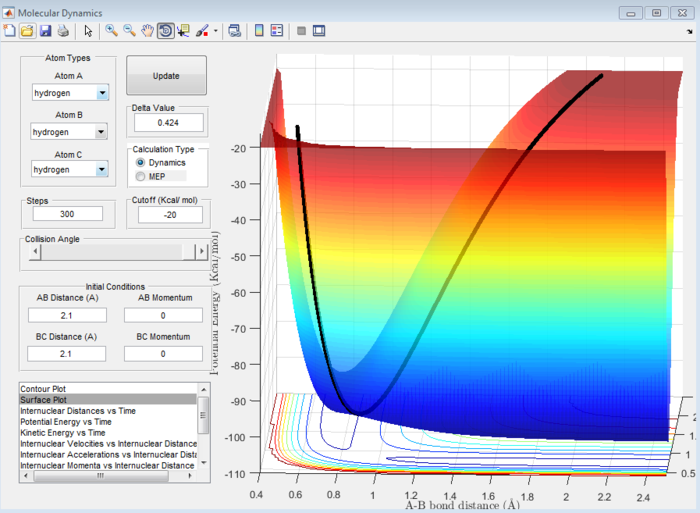

Question 3:Comment on how the mep and the trajectory you just calculated differ.
Answer 3:There are two main differences between the mep and dynamics calculations:In mep, only the transition state is included in the reaction path of the plot, whereas in Dynamics, the reaction path spans a wider range. The second prominent difference is the inclusion of mass in the Dynamics calculations as opposed to those in mep. This is evident due to the oscillating reaction path, indicating the use of masses. Both these differences can be observed in Figure 4 and 5 for mep and dynamics, respectively.
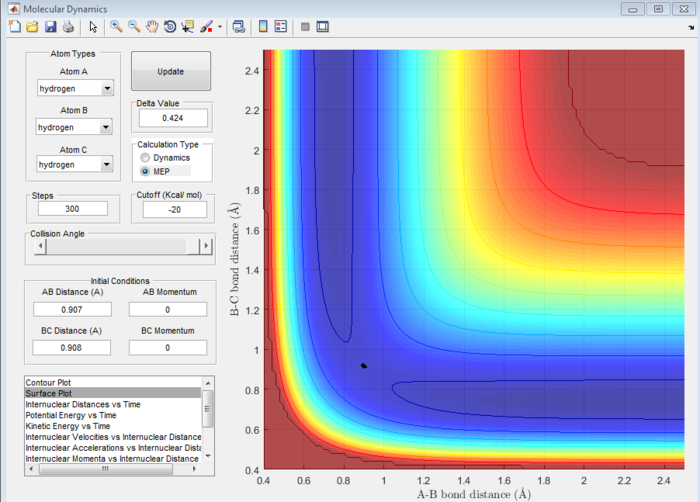

(Fv611 (talk) 12:08, 25 May 2017 (BST) There is confusion here. The mep is also run across the whole of the potential surface, but it's set up so that the trajectory it calculates corresponds to the system having the minimum possibel energy at all times. The difference between the two calculations is not in the treatment of mass, but in that of the velocities of the atoms.)
Question 4:Complete the table by adding a column reporting if the trajectory is reactive or unreactive. For each set of initial conditions, provide a screenshot of the trajectory and a small description for what happens along the trajectory.
Answer 4:
| p1 | p2 | Trajectory | Figure Number |
|---|---|---|---|
| -1.25 | -2.5 | Reactive | 6 |
| -1.5 | -2.0 | Unreactive | 7 |
| -1.5 | -2.5 | Reactive | 8 |
| -2.5 | -5.0 | Unreactive | 9 |
| -2.5 | -5.2 | Reactive | 10 |

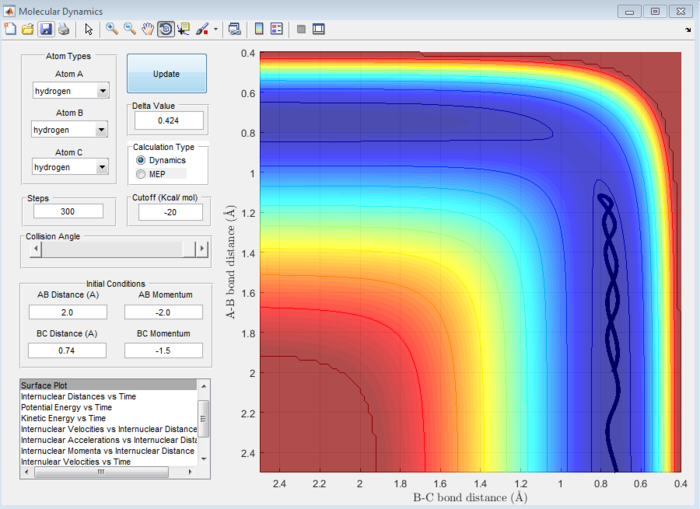
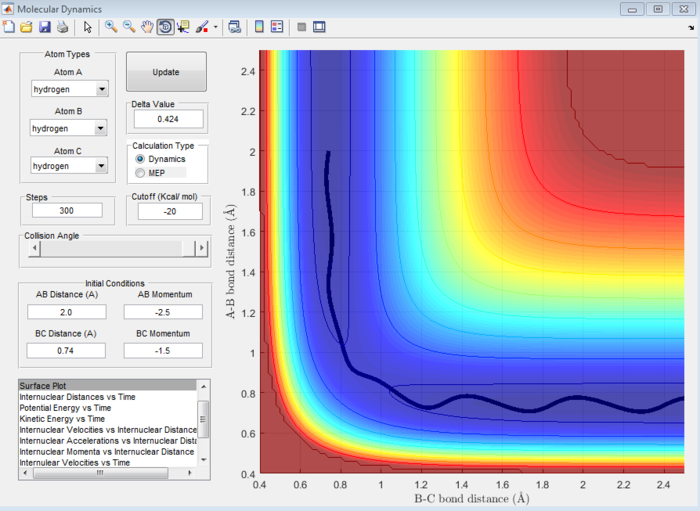
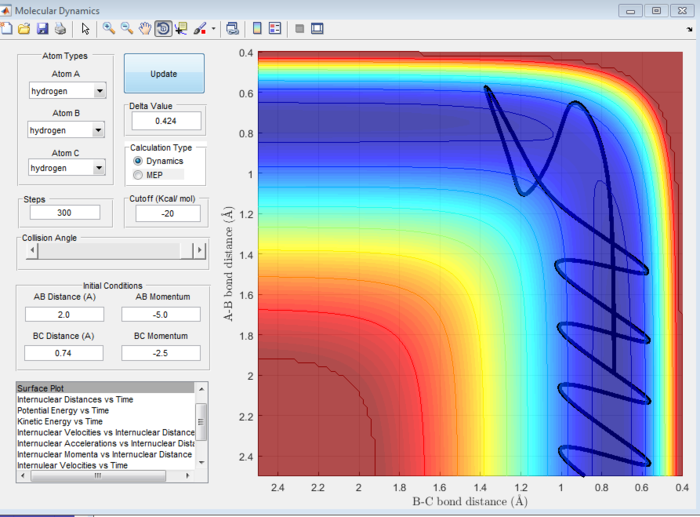
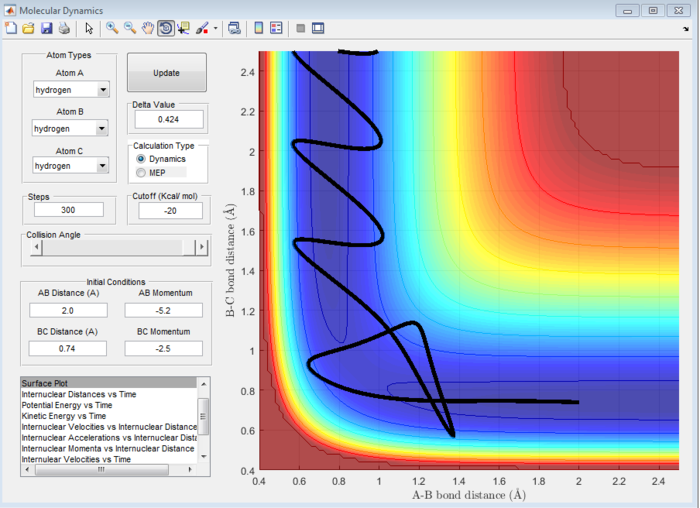
Question 5:State what are the main assumptions of Transition State Theory. Given the results you have obtained, how will Transition State Theory predictions for reaction rate values compare with experimental values?
Answer 5: It is assumed in Transition State Theory (TST) that the reactants and the activated complexes in a reaction are in quasi equilibrium . Another assumption is that when two molecules collide with a high enough energy, they will react and overcome the activation barrier at the transition state(where the energy is maximal on the potential energy vs internuclear distance curve) before the final products are formed. This assumption is in accordance with classical mechanics. However, quantum mechanics explains the phenomenon of tunneling and other alternative pathways. This means that if the collision does not have a high enough energy to overcome the activation energy at the transition state, the reaction can sometimes "tunnel" through the transition state as opposed to overcoming it. The reaction trajectory can also go via other lower energy alternative pathways. Because these effects are not accounted for in TST, the predicted reaction rate will be lower than the experimental values.[1]
(Fv611 (talk) 12:08, 25 May 2017 (BST) You make good points, but forget to describe how TST treats recrossing. Would something like reaction 4 in the previous question be predicted by TST? Also, your reference compares two types of Quantum TST, so I don't understand why you have cited it.)
Question 6:Classify the F + H2 and H + HF reactions according to their energetics (endothermic or exothermic). How does this relate to the bond strength of the chemical species involved?
Answer 6:In the F + H2 reaction, an H-H bond is being broken and an H-F bond is being made. On the other hand, in the H + HF reaction, an H-F bond is being broken and an H-H is being made. The H-H bond has a bond energy of 432 kJ/mol[2], whereas H-F has a bond energy of 565 kJ/mol[2]. The H-F bond, having a higher energy than the H-H bond, is a much stronger bond because more energy has to be put in to break it. ΔH(reaction)=H(bonds broken)-H(bonds made) so using this equation and referring to Table 2, it can be deduced that F + H2 is an exothermic reaction and H + HF is an endothermic reaction.
| ΔH(reaction)/kJ/mol | Energetics | |
|---|---|---|
| F + H2 | -133 | Exothermic |
| H + HF | 133 | Endothermic |
Question 7:Locate the approximate position of the transition state.
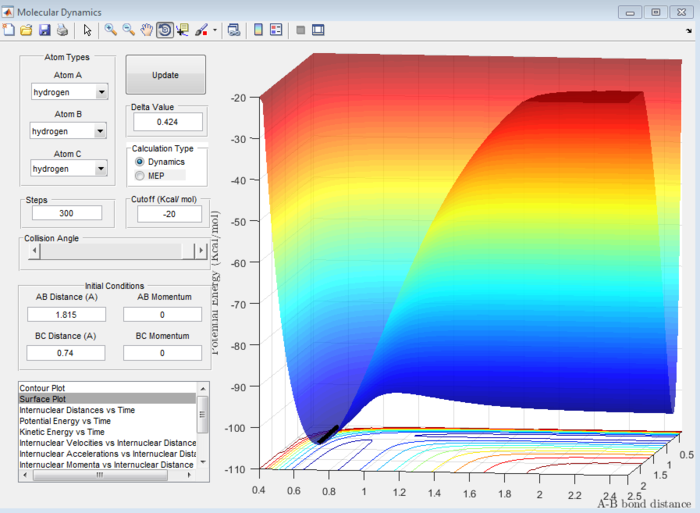
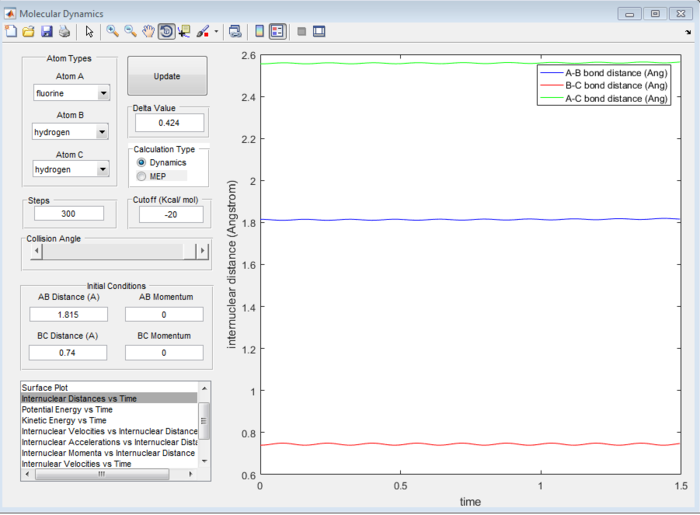
Answer 7:As mentioned in question 2, at the transition state, the internuclear distance is constant and no oscillation is seen on the internuclear distance vs time plot. The surface plot allowed for the transition state coordinates to be found (refer to Figure 11) and these were checked using the internuclear distance vs time plot (see Figure 12). It was determined that the H-F bond length is 1.815 Å and the H-H bond length is 0.74 Å at the transition state.
Question 8:Report the activation energy for both reactions.
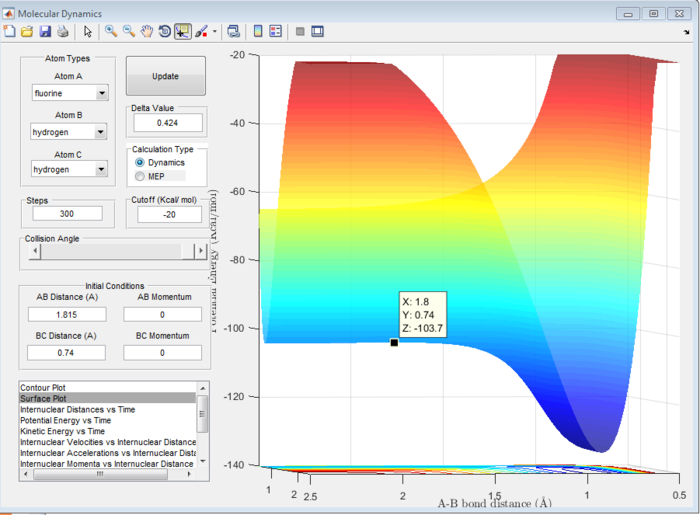
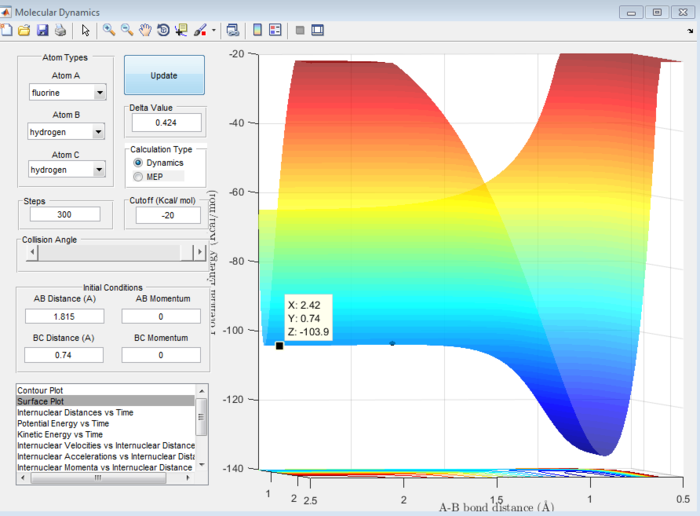
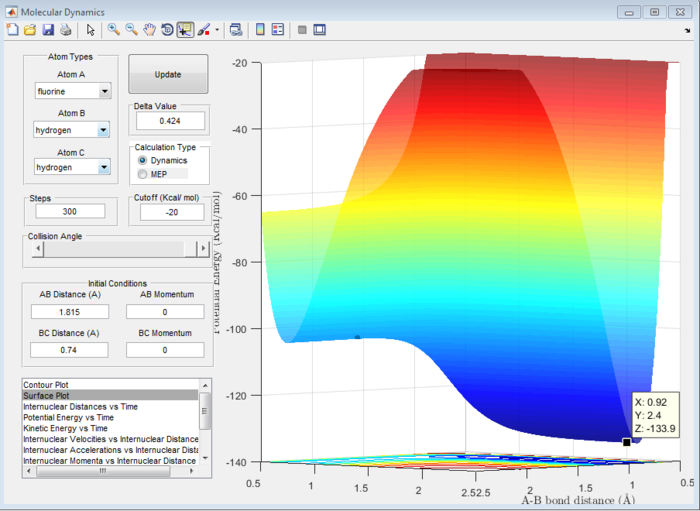
Answer 8:The activation energy is defined as the difference in energy between the transition state and the reactants. This will be different in the forward exothermic and backward endothermic reactions because the reactants will differ. The energies at the transition state and reactants can be determined using a surface plot. The transition state energy was found to be -103.7 kcal/mol (see Figure 13) which will be the same in both reactions. For the forward reaction, the energy of the reactants was -103.9 kcal/mol (see Figure 14), whereas in the backward reaction, the reactant energy was -133.9 kcal/mol (see Figure 15).
Hence, the activation energy for the forward reaction will be -103.7-(-103.9)= 0.2 kcal/mol and for the backward reaction it will be -103.7-(-133.9)= 30.2 kcal/mol. These are all approximate values.
Question 9:In light of the fact that energy is conserved, discuss the mechanism of release of the reaction energy. How could this be confirmed experimentally?
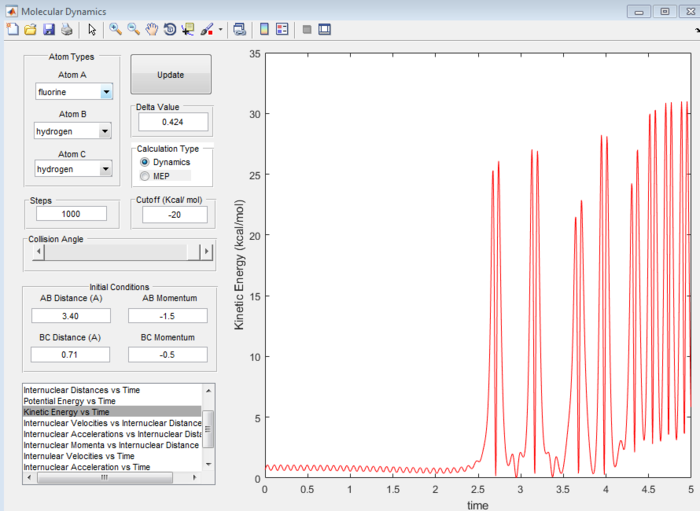
Answer 9:The total energy of a system is equal to the sum of its potential and kinetic energies. Because this (forward) reaction is exothermic, the potential energy of the products is lower than that of the reactants, so in order to obey the law of conservation of energy, the reactants must have a lower kinetic energy than the products. This can be explained by considering the strength of the H-F bond. As the H-F bond is much stronger than the H-H bond, it will have more vibrational energy and hence the products will have a higher kinetic energy than the reactants. This can be observed in Figure 16, the kinetic energy vs time graph shows a very large increase in kinetic energy as the reaction proceeds from reactants to products. The opposite is true for the reverse endothermic reaction. To confirm this experimentally, IR spectroscopy could be used because the molecules will vibrate and hence the bonds broken and made will appear as peaks in an IR spectrum. When this particular reaction has gone to completion, the vibrational modes of the H-F bond will appear in the spectrum as opposed to those in H-H which should be absent.
(Fv611 (talk) 12:08, 25 May 2017 (BST) Correct, but your discussion is very difficult to follow.)
Question 10:Discuss how the distribution of energy between different modes (translation and vibration) affect the efficiency of the reaction, and how this is influenced by the position of the transition state.
Answer 10:Polanyi's empirical rules state that an increase in translational energy favours an early transition state, whereas an increase in vibrational energy favours a late transition state.[3]
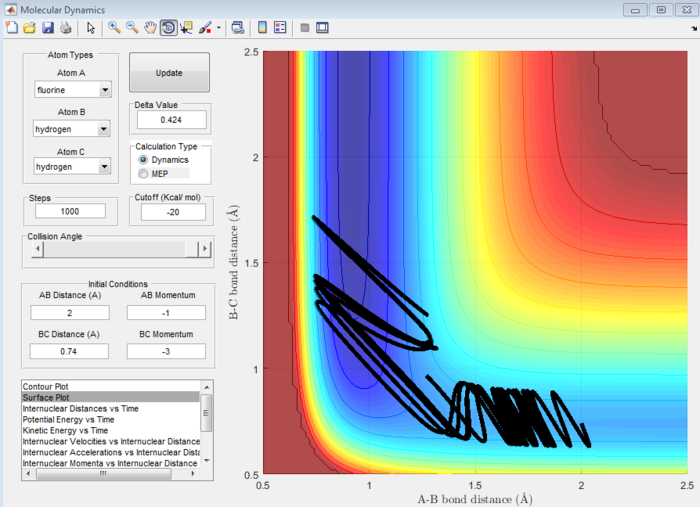
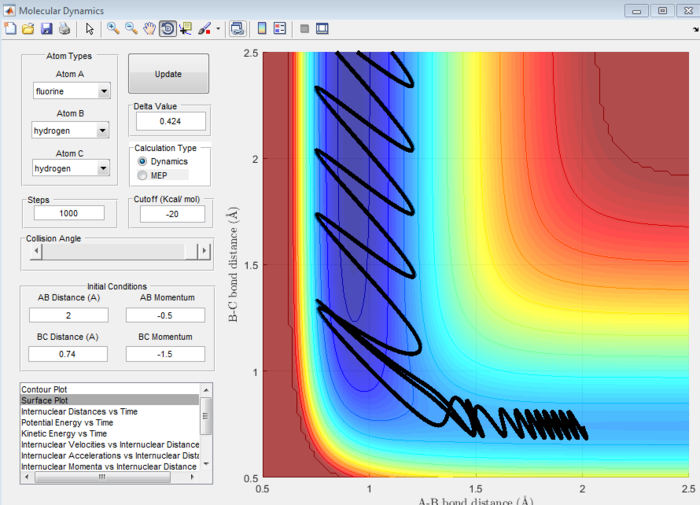
In the forward reaction, there is an early transition state because the reaction is exothermic so the transition state will be closer in energy to the reactants than the products. This means the transition state will strongly resemble the reactants. Hence, according to Polanyi's rules, a system with high translational energy and low vibrational energy will result in a less efficient set of reaction trajectories. This is because, as mentioned above, this high translational energy favours the early transition state making it more difficult for a reaction to go to completion. This can be observed in Figure 17. However, when the momentum and thus translational energy are decreased, there will be a more efficient set of trajectories and hence higher efficiency. (see Figure 18).[3]
In the backward reaction, there is a late transition state because the reaction is endothermic so the transition state is closer in energy to the products and hence closely resembles the products. In this case, a system with high vibrational energy and low translational energy favours this late transition state and results in a less efficient set of trajectories. When the bond length is increased and thus the vibrational energy decreased, the reaction is more efficient.[3]
(Fv611 (talk) Your discussion is not clear enough to be followed. "This is because, as mentioned above, this high translational energy favours the early transition state making it more difficult for a reaction to go to completion." Without specifying what type of reaction you are talking about, this sentence doesn't make any sense.)
References
- ↑ Hansen, Nancy Fisher, and Hans C. Andersen. "Properties Of Quantum Transition State Theory And Its Corrections". The Journal of Physical Chemistry 100.4 (1996): 1137-1143.
- ↑ 2.0 2.1 http://www.wiredchemist.com/chemistry/data/bond_energies_lengths.html access date:09.05.17
- ↑ 3.0 3.1 3.2 Yan, S., Y.-T. Wu, and K. Liu. "Tracking The Energy Flow Along The Reaction Path". Proceedings of the National Academy of Sciences 105.35 (2008): 12667-12672.
