MRD:hm1017
Molecular Reaction Dynamics: Applications to Triatomic System
H and H2 system
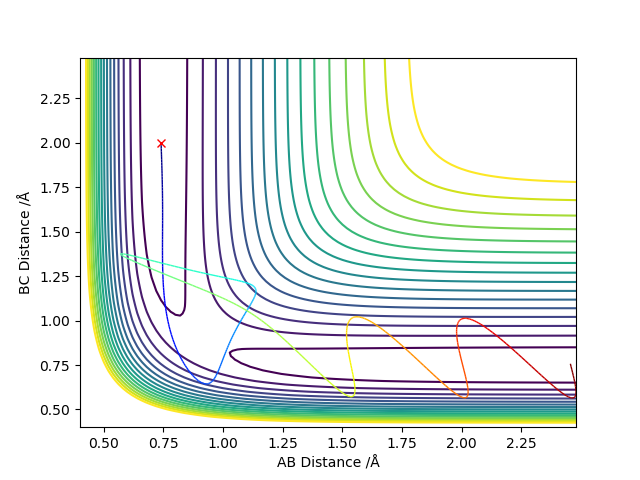
The initial conditions: rBC(0) = 0.74 Å, rAB(0) = 2.30 Å and the momenta pBC(0) = 0 pAB(0) = -2.7).
The atom A collides with the molecule BC and forms a new molecule with B, while C is detached as a separate atom.
Dynamics from the transition state region
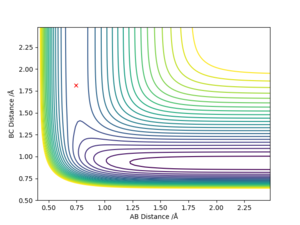
The transition state is defined as the maximum on the minimum energy path linking reactants and the products. This point on the potential energy surface has the special property that ∂V(ri)/∂ri=0. A reactive trajectory that passes through the transition structure is shown as a wavy line. The transition structure is a saddle point in the potential energy surface. In the transition state, AB distance is equal to BC distance. (The dot in the graph below is the transition state)
The mathematical definition of a saddle pointː For f(x,y), stationary points occur where fχ=0 and fʏ=0 simultaneously. Let (a,b) be a stationary pointː examine D=[fxxfyy-(fxy)^2]a.b. If D<0 then (a,b) is a saddle point. The mathematical definition of a local minimum of the potential energy surfaceː For f(x,y), stationary points occur where fχ=0 and fʏ=0 simultaneously. Let (a,b) be a stationary pointː examine D=[fxxfyy-(fxy)^2]a.b. If D>0 and fxx(a,b)>0, then (a,b) is a local minimum point. It means the local minimum is the point of intersection for minimum points of both surfaces; And the saddle point is the point of intersection for a minimum point in one surface and a maximum point for another surface.

Trajectories from r1 = r2: locating the transition state
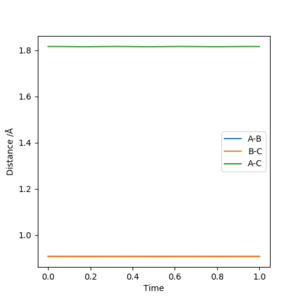
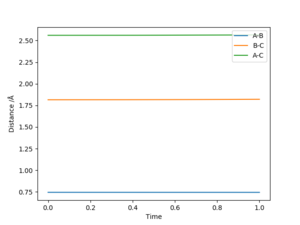
The best estimate of the transition state position is 0.908 Å. In the transition state, ri = r2 = 0.908 Å and pi = p2 = 0.0. In a “Internuclear Distances vs Time” graph, both distances of AC and BC are constant when time changes. It means that all three atoms are motionless.
Good but how did you get this value? Why is r1 and r2 equal? . Sf3014 (talk) 23:36, 28 May 2019 (BST)
Trajectories from r1 = rts+δ, r2 = r1
The reaction path (minimum energy path or mep) is a very special trajectory that corresponds to infinitely slow motion. Once the transition state has been located, one may run the very special “trajectory” that corresponds to the mep.
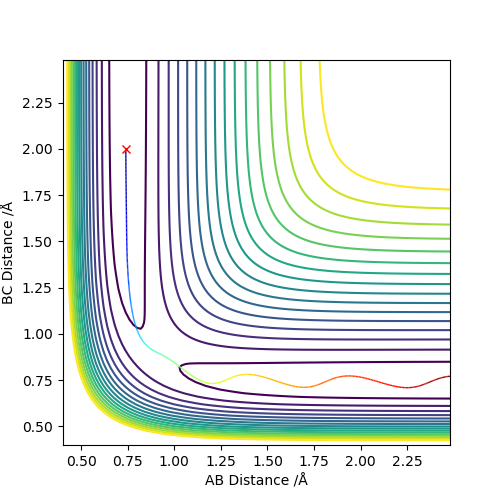
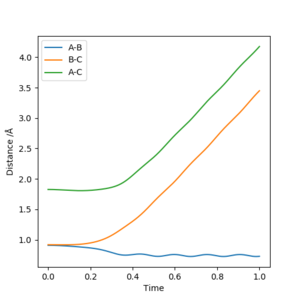
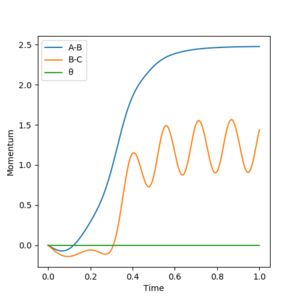
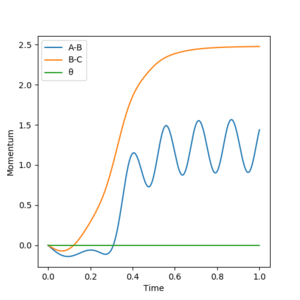
When the δ is changed, the larger the δ is, the less negative the total energy is. The kinetic energy is always zero and hence the total energy equals to the potential energy. If the same initial condition is used to calculate the reaction path, the calculation types cannot change the total energy. However, graphs of all plot types are different for the two calculation types, which shows they have different trajectories (the bold black line).
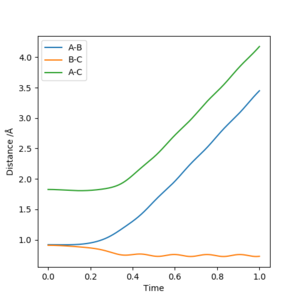
For r1 = rts+δ (r1=0.918 Å, r2=0.908 Å, p1 = p2 = 0), the reaction does not occur and thus BC has vibrational energy and shows wavy lines in both graphs. A is far away from BC and shows an increased diatance form B and increased momentum of AB. For r2 = rts+δ (r1=0.908 Å, r2=0.918 Å, p1 = p2 = 0), the reaction occurs and thus AB formed and it has vibrational energy and shows wavy lines in both graphs. C is far away from AB and shows an increased diatance form B and increased momentum of BC. This is not clear, you switch from talking about MEP to dynamic calculation without stating, the second paragraph doesn't mention any calculation. Also, what is little delta? This is not defined. Sf3014 (talk) 23:45, 28 May 2019 (BST)

Reactive and unreactive trajectories
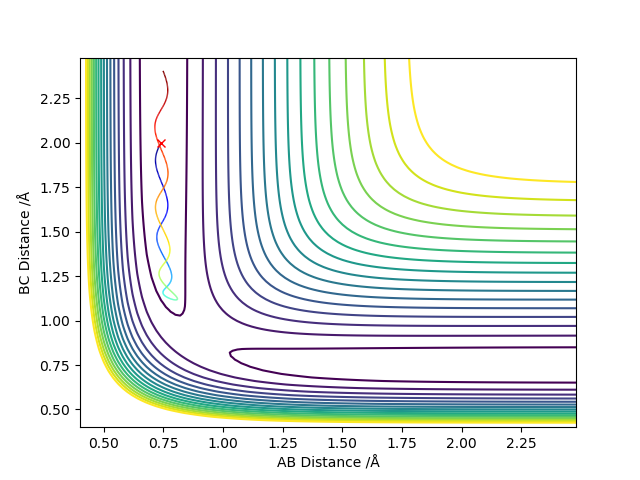
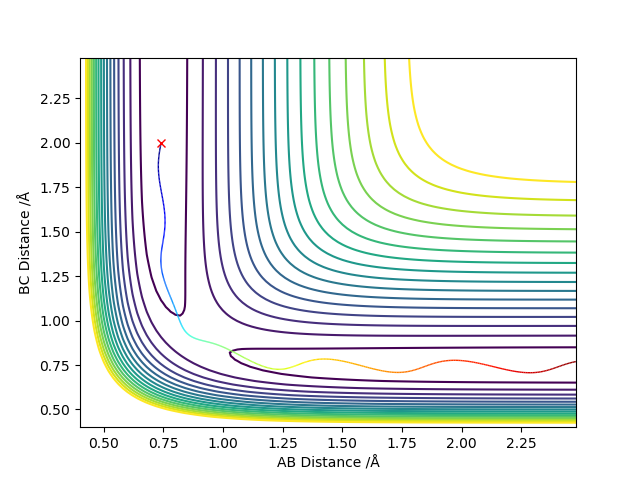
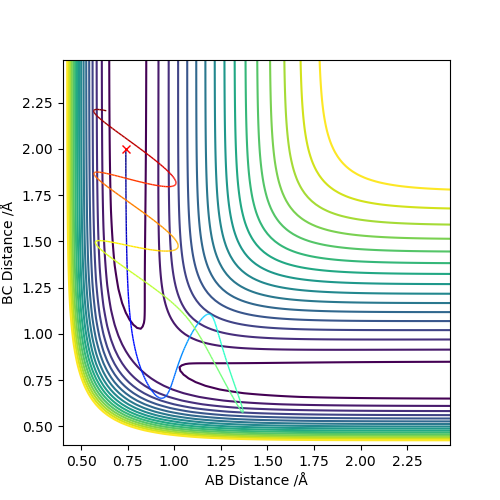
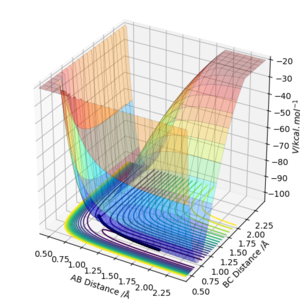
From the previous calculations we can conclude that trajectories with initial conditions in the range r1 = 0.74 Å, r2 = 2.0 Å, with -1.5 < p1 < -0.8 and p2 = -2.5 are reactive. For the initial positions r1 = 0.74 Å and r2 = 2.0 Å, run trajectories with the following momenta combination and complete the table.
Conclusion from the table above:
At the beginning, the potential energy is the same because of the same initial positions, while kinetic energies are different due to the different momentum. There is an activation energy at transition state, which needs to be overcame for a successful reaction. The increase in the momentum can increase the kinetic energy. Then reagents with large momentum will have enough kinetic energy to overcome the activation energy and the reaction will occur. If the momentum is small, then kinetic energy is not enough to overcome the activation energy, the reaction will not occur. However, if the momentum and kinetic energy is too large, the reaction will not occur because the product can reverse back to the reactant. If there is enough kinetic energy to generate the product again, the reaction can occur; Otherwise no reaction occurs. The total energy becomes less negative as the momentum increases due to the raised kinetic energy and constant potential energy. Good observations and conclusion. Sf3014 (talk) 23:58, 28 May 2019 (BST)
Transition State Theory vs Experimental Values:
The main assumptions of Transition State Theory: Reactants are in constant equilibrium with the transition state structure. The energy of the particles follow a Boltzmann distribution. Once reactants become the transition state, the transition state structure does not collapse back to the reactants. As can be seen from the last two rows in the table above, the product can reverse back to the reactant. It is inconsistent with the assumption - 'Once reactants become the transition state, the transition state structure does not collapse back to the reactants.' And if the reverse reaction occurs, the rate of reaction will decrease. Good but how does transition state theory (TST) compare to your trajectories? Refer to your table. Will the rate of the reaction be faster or slower based on TST compared to what you see in your trajectories?. Sf3014 (talk) 23:58, 28 May 2019 (BST)
F - H - H system
PES inspection
H-H bond: Bond Energy = 432 kJ/mol, Bond Length = 74 pm
H-F bond: Bond Energy = 565 kJ/mol, Bond Length = 92 pm
Bond formation is exothermic and bond broken is endothermic. F + H2 -> HF + H is exothermic (energy change = -133 kJ/mol), due to the formation of H-F bond, which has a larger bond energy. And H + HF -> H2 + F (energy change = +133 kJ/mol) is endothermic due to the break of H-F bond. Good but where did you get these bond energies? reference, please. Also, how can you see if the reaction is exo- or endo-thermic using the potential energy surface (PES)? And show PES graph. Sf3014 (talk) 00:02, 29 May 2019 (BST)
Transition Stateː
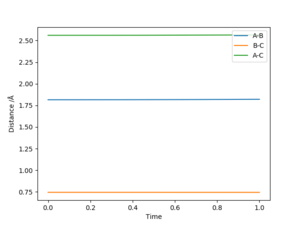
F + H2 -> HF + H is rAB = 1.815 Å and rBC = 0.745 Å, P1 =P2 = 0
H + HF -> H2 + F is rAB = 0.745 Å and rBC = 1.815 Å, P1 =P2 = 0
The transition state is defined as the maximum on the minimum energy path linking reactants and the products. This point on the potential energy surface has the special property that ∂V(ri)/∂ri=0. In the transition state, Internuclear Distances should be constant as time changes. According to the Hammond's Postulate, the energy of transition state is closer to the reagents in an exothermic reaction (early TS); And the energy of transition state is closer to the products in an endothermic reaction (late TS). Hence F + H2 → HF + H reaction is exothermic and early TS and H + HF → F + H2 reaction is endothermic and late TS.

Very good but must define A, B and C. And reference for Hammond's postulate would be good. Sf3014 (talk) 00:04, 29 May 2019 (BST)
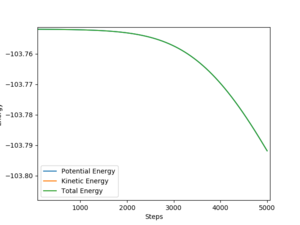
Activation energy can be calculated by 'Energy vs Time graph'ː
F + H2 -> HF + H is 0.044 kJ/mol
H + HF -> H2 + F is 23.764kJ/mol
Energy vs Time graph by MEP methods, steps numbers = 5000, steps size = 0.002

Good but more description on calculation is needed, ie "the activation energy is the energy difference between...". Also, the energy units are kcal/mol. Sf3014 (talk) 00:08, 29 May 2019 (BST)
Reaction dynamics
From 'Energy vs Time' graph, the total energy is always constant, which shows the energy conservation. Potential energy decreases while kinetic energy increases after the reaction. It is a proof that the reaction F + H2 → HF + H is exothermic; a reasonable experimental observation is the increased reading in the thermometer during the reaction. From the 'Momenta vs Time' graph, as the reaction takes place, the vibration of AB is destroyed, indicating that the H-H bond is broken. And the more negative BC momentum shows the formation of the H-F bond. The vibration of BC after the reaction shows that the excess kinetic energy can be converted into vibrational energy.
Setup a calculation starting on the side of the reactants of F + H2, at the bottom of the well rHH = 0.74 Å, with a momentum pFH = -0.5, and explore several values of pHH in the range -3 to 3 (rFH = 1.815 Å)ː If the pHH is small, the reverse reaction does not occur. As the pHH increases, the reaction becomes faster and there is sufficient energy to reverse the reaction.
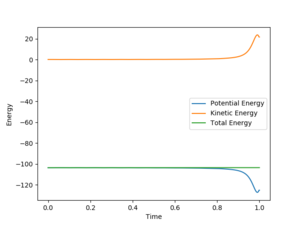
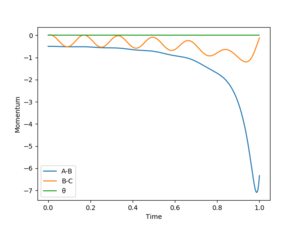
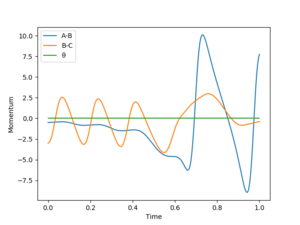
For H + HF → F + H2, pHF would be small while pHH would be large for a successful reaction. Because the H atom needs a large high kinetic energy to overcome the potential energy to approach the HF molecule. And H-F bond only has a vibrational energy, which does not have to be large. From 'Skew Plot', it is can be seen that if pFH is smaller than pHH (pFH = 0.5, pHH = 5), no reverse reaction; While reverse reaction occurs if pFH is larger than pHH(pFH = 5, pHH = 0.5).
According to the Hammond's Postulate, the energy of transition state is closer to the reagents in an exothermic reaction (early TS); And the energy of transition state is closer to the products in an endothermic reaction (late TS). Kinetic energy affects the reactants more, and vibrational energy affects the products more. Hence higher kinetic energy is favoured to the exothermic reaction (early TS), and higher vibrational energy is favoured to the endothermic reaction (late TS). Good but Polanyi's rules were mentioned without stating that they are Polany's rules. Also, you should conclude this with reference to your observations in comparison to Polanyi's rules. Sf3014 (talk) 00:17, 29 May 2019 (BST)


Reference
1. Atkins, P., de Paula, J., Elements of Physical Chemistry, 5th ed.; Oxford University Press, 2009.
2. Huheey, pps. A-21 to A-34; T.L. Cottrell, "The Strengths of Chemical Bonds," 2nd ed., Butterworths, London, 1958; B. deB. Darwent, "National Standard Reference Data Series," National Bureau of Standards, No. 31, Washington, DC, 1970; S.W. Benson, J. Chem. Educ., 42, 502 (1965).

