
MRD:ha3915
Molecular Reaction Dynamics: Applications to Triatomic systems
Introduction
A Matlab script was used to generate plots and trajectories for potential energy surfaces (PES) of the collision between three atoms (one diatomic molecule and an atom) to help understand the Molecular reaction dynamics of triatomic systems. a H + H2 system and an F-H-H system were analysed and their reactivity was determined from the reaction path and transition state properties. A PES is a two-dimensional function of the two distances (relative) between the three atoms. Information such as the transition state can be extracted from such function which enable the calculations of thermodynamic properties about the system.
H + H2 system
In this section, we shall consider the molecular reaction dynamics of a system of three H atoms. The initial conditions (which determine the trajectory and hence the dynamics of the reaction) in Figure 1 were used.

These conditions describe the following reaction system shown in the animation (click to play) in Figure 2.

Considering the reaction's trajectory within the potential energy surface (PES) plot, the reactant and product channels can be determined. Figure 3 shows the plot.

The black line shows the path of the reaction, it's wavy due to vibrational motion, however it should be noted that energy in conserved; this can be seen as the oscillations between energy contours are of constant amplitude.
As shown in Figure 2, the internuclear distances change over time. Figure 4 shows the change of internuclear distances.

Furthermore, a potential energy vs time graph can be seen in Figure 5.

Dynamics from the transition state region
1) What value does the total gradient of the potential energy surface have at a minimum and at a transition structure? Briefly explain how minima and transition structures can be distinguished using the curvature of the potential energy surface.
The total gradient of the potential energy surface at a minimum and at a transition structure has a value of 0. They can be distinguished by using the second derivative test. Since the transition structure is a saddle point of a two-dimensional function, then the partial derivative with respect to both variables is 0 (as well as at the minimum). Let the second derivative test discriminant
then if , the point is a minimum, if , the point is a saddle and hence is the transition structure.
(Fv611 (talk) 12:14, 29 May 2017 (BST) Good. Could have referenced the second derivative test)
Locating the transition state
2) Report your best estimate of the transition state position (rts) and explain your reasoning illustrating it with a “Internuclear Distances vs Time” screenshot for a relevant trajectory.
In order to estimate the transition state, trial and error was used. The best estimate was determined to be the one with the smallest vibrational amplitude. Since the system is symmetric it was known that the transition state was at r1=r2 hence, different values were tested and the internuclear distance was observed (Figure 6). The transition state position was determined to be rts = 0.90778 Angstrom.

As shown, the internuclear distances do not change with time, this means that the atoms are in the transition state, as such even vibrational motion is minimised and hence, the distances are straight lines.
(Fv611 (talk) Correct, however rather than guessing the TS location, you could have started by identifying where r1=r2 in a reactive trajectory)
Minimum energy path (MEP) comparison
3) Comment on how the MEP and the trajectory you just calculated differ.
The MEP calculation resets the velocity to 0 at each step and hence, it is expected that the trajectory will oscillate less and be smoother as when equilibrium distance is reached, no further oscillations take place. Figures 7 and 8 show the results.
 |
 |
As expected, since the atom moves in infinitely slow motion, the MEP has a much smoother trajectory. Whereas dynamics takes into account the vibrational fluctuations. Further detail of the dynamics can be seen in the momentum plots and the internuclear distance plots where r2 = 0.91778 (rts + 0.01) rather than r1.
 |
 |
 |
 |
As shown, the plots are identical apart from the atom labeling, this is due to the symmetric nature of the system causing the opposite initial positions to have the same change in momenta and distance over time.
Reactive and unreactive trajectories
4) Complete the table by adding a column reporting if the trajectory is reactive or unreactive. For each set of initial conditions, provide a screenshot of the trajectory and a small description for what happens along the trajectory.
| p1 | p2 | Reactive? | Trajectory | Description |
|---|---|---|---|---|
| -1.25 | -2.5 | Yes |  |
|
| -1.5 | -2.0 | No |  |
|
| -1.5 | -2.5 | Yes |  |
|
| -2.5 | -5.0 | No |  |
|
| -2.5 | -5.2 | Yes |  |
|
(Fv611 (talk) 12:14, 29 May 2017 (BST) Correct. Could have discussed a bit more (why are reaction 1 and reaction 3 different?)
Transition state theory
5) State what are the main assumptions of Transition State Theory. Given the results you have obtained, how will Transition State Theory predictions for reaction rate values compare with experimental values?
Assumptions
- Classical (Newtonian) mechanics are used to describe the motion of the particles. Relativistic and quantum effects (tunneling) are ignored.[1]
- Activated complexes are always in quasiequilibrium with the reactants.
- Each intermediate reaches the Boltzmann energy distribution before the sequential steps. Whereas not all intermediates are long-lived enough to reach the distribution.
- The transition state is reached only once.
- Once the transition state is reached, the trajectory is reactive.
- The energies follow the Boltzmann distribution in every degree of freedom[2]
Comparison with experimental values
- At high temperatures, reaction rates are usually overestimated by transition state theory due to the assumption that once the transition state is reached, the trajectory is reactive.
- At low temperatures, reaction rates are underestimated by transition state theory as quantum tunneling effects become much more prevalent.
(Fv611 (talk) 12:14, 29 May 2017 (BST) Good, could have related to your observations in the previous question)
F-H-H System
PES inspection
6) Classify the F + H2 and H + HF reactions according to their energetics (endothermic or exothermic). How does this relate to the bond strength of the chemical species involved?
7) Locate the approximate position of the transition state.
8) Report the activation energy for both reactions.
F + H2
Energetics classification
This reaction is exothermic as the reaction profile (Figure 13) shows the products having lower potential energy surface than the reactants. This can be explained by investigating the bond energies as a H-F bond is stronger than a H-H bond so energy is released during bond making.

Transition state location estimation
The transition state was located by using Hammond's postulate, which states that the activated complex at the transition state most likely resembles the channel with the more similar energy, with the difference only involving a small rearrangement of atoms (the reactants in this case as the reaction is exothermic). Since the reactants have a H-H bond, it was assumed that this bond still existed in the TS as such, it was estimated that rBC = 0.745 Å, the bond length of H-H[3] where as rAB was thought to have a much larger length than H-F which is 0.94 Å.[3]
The transition state was found to be at rAB = 1.812 Å, rBC = 0.745 Å. Shown in Figure 14 below.

Activation energy
The activation energy is the energy difference between the reactants and the transition state, The energies of both species were obtained and the activation energy was calculated to be 0.2 kcal/mol. Figure 15 shows the results.

H + HF
Energetics classification
This reaction is the reverse of the previous one, it is hence endothermic as the reactants have a lower potential energy surface than the products, so energy needs to be added to the system for the reaction to proceed. Also since the H-F bond is stronger than H-H, more net energy is needed to break H-F than that released by H-H formation.

Transition state location estimation
Since this is the reverse reaction, the positions are reversed, hence, rBC = 1.812 Å, rAB = 0.745 Å.

Activation energy
An MEP calculation was used for a more accurate measurement of the activation energy, which is 30.1kcal/mol

Reaction dynamics
9) In light of the fact that energy is conserved, discuss the mechanism of release of the reaction energy. How could this be confirmed experimentally?
- The two step reaction (F + H2) involves the F approaching H, forming a transition state which the reaction fails to overcome the barrier, the distance between the H atoms increase. The F approaches a second time and forms a H-F bond, since the reaction is exothermic and energy is conserved, the energy released during bond formation is converted to vibrational energy causing large momenta fluctuations as seen in the figures below.
- This can be experimentally confirmed by calorimetry, measuring the heat released by the reaction (the kinetic energy) as heat is a result of friction due to motion. Since Q=mcΔT where Q is the heat energy, m is the mass of the system, c is the specific heat capacity and ΔT is the observed temperature change.
- IR spectroscopy can also be used as only H-F is IR active due to the assymetric dipole moment change.
 |
 |
- Setup a calculation starting on the side of the reactants of F + H2, at the bottom of the well rHH = 0.74, with a momentum pFH = -0.5, and explore several values of pHH in the range -3 to 3. What do you observe?
- Between pHH = 3 and 2 the system has enough energy to overcome the barrier however in some cases, the energy is too large and the trajectory becomes unreactive with the extra energy being converted to vibrations and the reactants are reformed.
- When pHH is less than 2 the reaction is unsuccessful due to there not being enough kinetic energy to overcome the barrier.
 |
 |
 |
 |
 |
 |

- For the same initial position, increase slightly the momentum pFH = -0.8, and considerably reduce the overall energy of the system by reducing the momentum pHH = 0.1. What do you observe now?
- The reaction is now successful but passes through many transition states and keeps breaking apart and reforming in a loop.
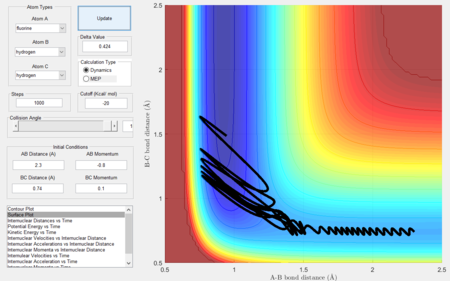
Figure 28: surface plot of F + H2. With rHH = 0.74, with a momentum pFH = -0.8 and pHH = 0.1
- The reaction is now successful but passes through many transition states and keeps breaking apart and reforming in a loop.

Polyani's empirical rules
10) Discuss how the distribution of energy between different modes (translation and vibration) affect the efficiency of the reaction, and how this is influenced by the position of the transition state.
Polyani's rules state that vibrational energy contributes more in a late barrier reaction than translational energy, i.e. vibrational energy promotes the transition state which resembles the product more than translational energy[4] the reverse is true when considering transition states resembling reactants. In this case with the endothermic reaction, the transition state resembles the product and hence in conjunction with Hammond's postulate, the greater the vibrational energy the more successful the reaction as seen in figures 29 and 30 below.
 |
 |
Conclusion
PES plots and reaction trajectories were analysed to determine the dynamics of triatomic systems, The energetic classifications, transition state bond lengths and activation energies were calculated for F-H-H systems. Transition State theory and Hammond's Postulate were utilised to identify transition state locations and reaction pathways. An F + H2 reaction was determined to be exothermic whereas a H + H-F reaction is endothermic. Polyani's empirical rules were also used to determine a reaction's success.
(Fv611 (talk) 12:14, 29 May 2017 (BST) Nice discussion in the second part of the exercise)
References
- ↑ Atkins. P, Paula. J, Physical Chemistry, Oxford University Press, 2014
- ↑ G. Mills, H. Jønsson and G. K. Schenter, Surf. Sci. 324, 305 (1995)
- ↑ 3.0 3.1 T. L. Cottrell, The Strengths of Chemical Bonds, 2d ed., Butterworth, London, 1958; B. deB. Darwent, National Standard Reference Data Series, NationalBureau of Standards, no. 31, Washington, 1970; S. W. Benson, J. Chem. Educ. 42:502 (1965); and J. A. Kerr, Chem. Rev. 66:465 (1966).
- ↑ Theoretical Study of the Validity of the Polanyi Rules for the Late-Barrier Cl + CHD3 Reaction, Zhaojun Zhang, Yong Zhou, Dong H. Zhang, Gábor Czakó, and Joel M. Bowman, 2012 3 (23), 3416-3419, DOI: 10.1021/jz301649w