MRD:gs2016
Exercise 1
What value do the different components of the gradient of the potential energy surface have at a minimum and at a transition structure? Briefly explain how minima and transition structures can be distinguished using the curvature of the potential energy surface?
The gradient for both the transition state and a minimum will be 0. The 2nd derivative for a transition state will be negative and that of a minimum will be positive.
Jas213 (talk) 13:44, 28 May 2018 (BST) Correct, but doesn't mention the dimensionality of the surface? What can you say about the shape of the PES at TS?
Report your best estimate of the transition state position (rts) and explain your reasoning illustrating it with a “Internuclear Distances vs Time” plot for a relevant trajectory.
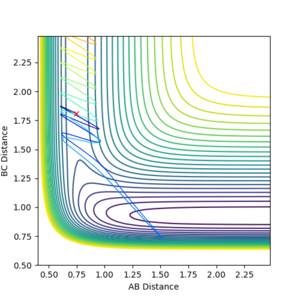
At the transition state Rab=Rbc=0.90774255. The forces AB and BC at this point are 0 and no oscillation is seen. A single dot is seen at the minimum of the Potential energy graph on the Surface plot. The internuclear graph shows that the distances between all 3 atoms remain the same over time and there is no interaction and therefore reaction at this position.

Jas213 (talk) 13:44, 28 May 2018 (BST) You could have plotted the single dot as well. What unit is r in? What forces are you talking about? What units are they in?
Comment on how the mep and the trajectory you just calculated differ.
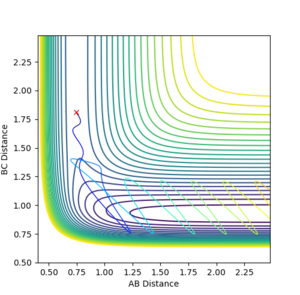
The reaction continues to the products when BC (r1) is increased by 0.01. The mep internuclear graph shows that the distance AB decreases while BC increases so the reaction moves towards the product. No vibrational energy is seen. However, with the dynamic calculations the distance AB decreases and then vibrational energy is seen after the reaction goes to products.
Jas213 (talk) 13:47, 28 May 2018 (BST) Where are your plots for this? You need to give plots to show your working. Without plots the comparison between men and dynamic is not clear.
Complete the table by adding a column with the total energy, and another column reporting if the trajectory is reactive or unreactive. For each set of initial conditions, provide a plot of the trajectory and a small description for what happens along the trajectory.
| p1 | p2 | Total energy | Reactive(R)/Unreactive(U) |
|---|---|---|---|
| -1.25 | -2.5 | -99.018 | R |
| -1.5 | -2.0 | 100.456 | U |
| -1.5 | -2.5 | -98.956 | R |
| -2.5 | -5.0 | -84.965 | U |
| -2.5 | -5.2 | -83.416 | R |
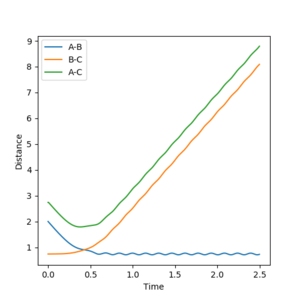
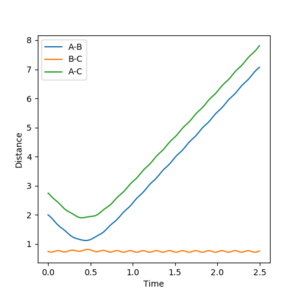

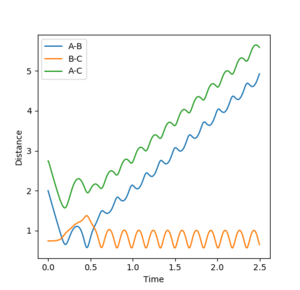
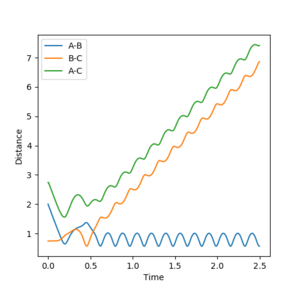
Jas213 (talk) 13:47, 28 May 2018 (BST) Again, not a single contour or surface plot is given. It looks like you did not understand these plots. The comments are very short, do not mention recrossing. An overall concluding comment on what you took away from this table would have been expected.
State what are the main assumptions of Transition State Theory. Given the results you have obtained, how will Transition State Theory predictions for reaction rate values compare with experimental values?
The Transition State Theory assumes the following:
-Atomic nuclei behave according to classical mechanics.
-If atoms do collide with enough energy to form the transition state, the reaction will occur.
-The system will take the lowest energy transition state.
With this said, experimental values might show lower reaction rates because the theory underestimates how much energy will be required to get the reaction going and does not account for the fact that the system can return to reactants after reaching the transition state.
Jas213 (talk) 13:49, 28 May 2018 (BST) Correct, but where are your references for this?
Exercise 2
Classify the F + H2 and H + HF reactions according to their energetics (endothermic or exothermic). How does this relate to the bond strength of the chemical species involved?

Jas213 (talk) 13:58, 28 May 2018 (BST) Why do you have two dots very high up on your PES?
F + H2 is exothermic because the energy of the reactants is more than the energy of the products. H + HF is endothermic as it is the reverse of the first reaction and this time the products have more energy than the reactants. The H-F bond is stronger than H-H because more energy has to be put into it to break the bond.
Jas213 (talk) 13:52, 28 May 2018 (BST) You could have illustrated this by commenting on the relative energies of the product and reactant channel in your surface plot or by giving bond energies, explaining why the HF bond is stronger than the HH bond.
Locate the approximate position of the transition state.
AB=1.8115
BC=0.7445
Jas213 (talk) 13:52, 28 May 2018 (BST) How did you find these values? You should have provided plots proving that this is the true TS eg. an MEP plot or a distance vs. time plot.
Report the activation energy for both reactions.
Hammond's postulate states that in an exothermic reaction the energy of the transition state closely resembles the energy of the reactants as there is likely to be less rearrangement of the reactants. It also states that in an endothermic reaction the energy of the transition state resembles the energy of the products more closely as there has been more rearrangement of the reactants.
Activation energy of F + H2 = 0.15
Activation energy of H + HF = 17.002
The H+HF Ea seems wrong, what are your units?
Plotting the internuclear distance against time graph using mep helps show whether products have been formed, the reactants are present or the reaction is at the transition state.
Jas213 (talk) 13:55, 28 May 2018 (BST) Then why didn't you provide the plot?
In light of the fact that energy is conserved, discuss the mechanism of release of the reaction energy. How could this be confirmed experimentally?
Energy from breaking down of H2 to form HF is used as firstly transitional energy for formation of the HF bond as the H moves away and the energy left is used for vibration of the HF molecule. IR of the resulting product could be taken, peaks are evidence of vibration in the molecule. (NMR could be used to confirm that the HF molecule has been formed initially).
Discuss how the distribution of energy between different modes (translation and vibration) affect the efficiency of the reaction, and how this is influenced by the position of the transition state.
For exothermic reactions, translational energy is more useful for the formation of products than vibrational energy. This is seen from the little change when the momentum of vibration of H2 is increased but much larger effect (reaction going to products--HF formed) when the momentum with which F hits H2 is increased.
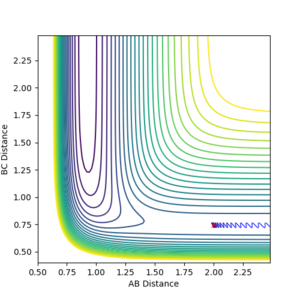
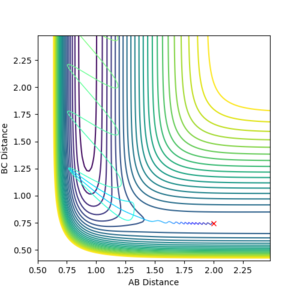
For endothermic reactions, the opposite is true. Increased translational energy has no effect on moving reaction to products and increasing vibrational energy is more important to move reaction towards prodcucts. High HF vibrational energy moves the reaction forward to the products while increasing the translational energy does not move the reaction towards formation of products.
Jas213 (talk) 13:55, 28 May 2018 (BST) Whose rules are you referring to here? All your trajectory plots lack details regarding the parameters used. You did not provide any momenta, hence impossible to know what you are referring to. You should have numbered the figures and then cite them in your explanations. What's your overall conclusion from this? Is this meant to be the exercise where you vary the momenta between -3 and +3? Again references would have been great.
