MRD:glynisyu
H + H2 system
What value do the different components of the gradient of the potential energy surface have at a minimum and at a transition structure? Briefly explain how minima and transition structures can be distinguished using the curvature of the potential energy surface.
The gradient of the potential energy surface diagram at a minimum and at a transition state are both zero, ∂V/∂r=0.
The minima and transition structures can be distinguished using the PES by finding the second derivative as the transition state exists as a saddle point in the potential energy surface plot. At a minima, the second derivative ∂2V/∂r2 will only have a positive value. The transition state however, will have both positive and negative values for the second derivative. Using the curvature of the potential energy surface, the transition state can be identified as it will appear as a maximum in the direction of reactants to products but will appear as a minimum in the energy axis of the surface plot.
Mm10114 (talk) 18:41, 14 May 2018 (BST) A good attempt, but you have to put more effort into discussing it in a more clear way and to not mix things together. The first observation about the gradient at the minimum and the transition state is ok, but it would have been good to actually state some derivatives here instead of just referring to generic "first" or "second order" derivatives. You have to remember that the potential energy surface you are describing is two-dimensional (2D). What is the result of it? I think this is were your confusion arises. Is there going to be only one first partial derivative and one second partial derivative for each minimum or transition state? You write it in a way that the second partial derivative for the transition state is both positive and negative. How is this possible at the same time? I think you are missing a point there are two second partial derivatives depending on the reaction direction. Possibly, using figures for the potential energy surface would help you to understand and explain better?
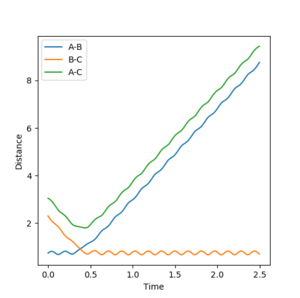
Report your best estimate of the transition state position (rts) and explain your reasoning illustrating it with a “Internuclear Distances vs Time” plot for a relevant trajectory.
As the molecule is symmetric, the position of the transition state is at the distance where AB=BC. This is the point at which the individual H atom and diatomic hydrogen collide. An estimate for this distance was found to be AB=BC=0.91. This was first approximated by looking at the Internuclear Distance vs Time graph, and finding the point at which the distance AB and BC intersect. The exact point of the transition state will have a momentum of 0. Once these conditions were set, a more accurate distance could be found. The best approximation would be where the two lines appear straight and layered on top of each other, i.e. where the distances are equal. Using this method, a better estimation was found to be AB=BC=0.9077425. An Internuclear Momenta vs Time graph was also used to best approximate the distances. For the best approximation, the amplitude of the momentum is as small as possible.
Mm10114 (talk) 18:41, 14 May 2018 (BST) Again, I can see you're trying to explain it with your own words, but you're lacking a lot of detail. You should define what AB and BC is first. Are you certain the transition state is the point at which the particles collide? You report the AB,BC distance as 0.91, first of all what is the unit? Secondly, you're lacking a description of the procedure of how did you find this value.


Comment on how the mep and the trajectory you just calculated differ.
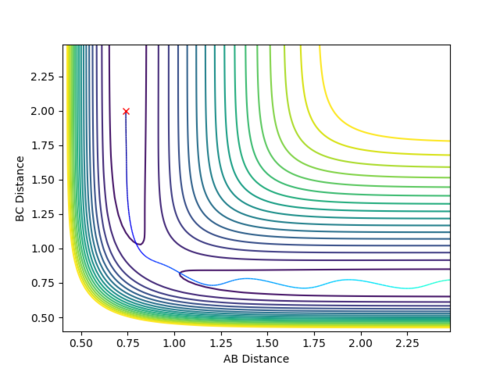
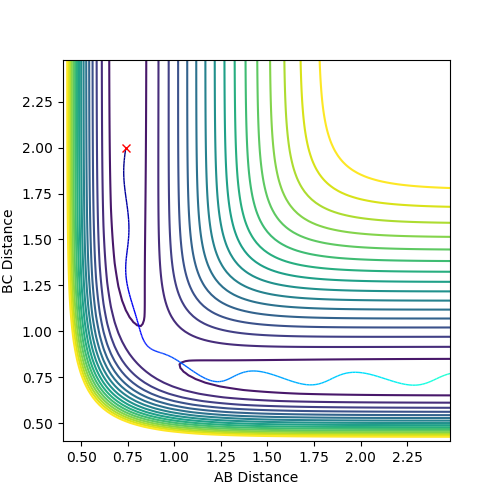
The mep (the minimum energy pathway) is the trajectory which essentially sets momentum equal to zero and therefore goes through the minima of the energy surface plot. In reality, the diatomic molecule vibrates and so the distance between the molecules is constantly fluctuating, as is its momentum and energy. When looking at the energy surface plot for dynamics, the pathway followed fluctuates about the minimum energy, as opposed to following the minima as shown in the mep.
Mm10114 (talk) 18:41, 14 May 2018 (BST) It is not clear from your description when the momentum in MEP is set to zero. You definitely need a more detailed description in here of the two methods MEP and dynamics first. You then describe plots, but where are they? You should attached them to your wiki.
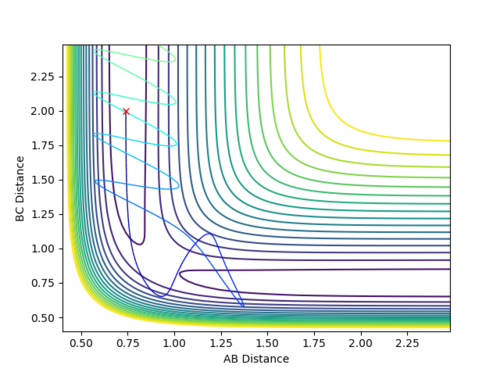
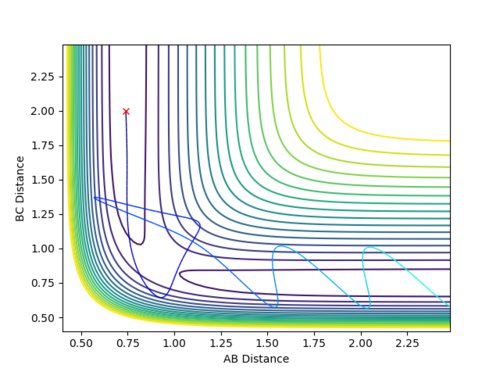
Complete the table by adding a column with the total energy, and another column reporting if the trajectory is reactive or unreactive. For each set of initial conditions, provide a plot of the trajectory and a small description for what happens along the trajectory.
Mm10114 (talk) 18:41, 14 May 2018 (BST) The re-colliding and re-forming process in the two last examples is called 're-crossing' that you should find in the references provided for the lab in the wiki. You could've define this process and describe in little more detail in respect to your contour plots.
State what are the main assumptions of Transition State Theory. Given the results you have obtained, how will Transition State Theory predictions for reaction rate values compare with experimental values?
Transition State Theory is used to predict the rate of reaction. Main Assumptions to the theory are:
1. TST calculates the rate of passing through a bottleneck which is found through TST .[1]
2. There is a quasi-equilibrium between the reactants and the products.
Predictions made using TST are done when temperatures are normal. This means there will only just be enough energy to reach the energy barrier.
Mm10114 (talk) 18:41, 14 May 2018 (BST) This answer is a little to short and telegraphic. You should've attempt to show the understanding of the TST assumptions and compare them to the findings of this exercise. You should mention the re-crossing observed in the previous examples and how would that affect the theoretical predictions in comparison with the experimental values. Are there any other aspects of the TST theory that would deviate the theoretical reaction rates from experimental ones?
EXERCISE 2: F - H - H system
Classify the F + H2 and H + HF reactions according to their energetics (endothermic or exothermic). How does this relate to the bond strength of the chemical species involved?
The reaction F + H2 -> HF + H is an exothermic reaction. As the hydrogen molecule approaches fluorine and collides, the energy of the system decreases to give more stable products. As energy cannot be created or destroyed in accordance with the 1st Law of Thermodynamics, the HF molecule formed moves away with a much higher vibrational energy. Temperature is a measure of kinetic energy on a microscopic scale, therefore the increase in vibrational energy makes the reaction exothermic. The reaction leads to more stable products because fluorine is highly electronegative and the H-F bond is stronger than the H2 bond.
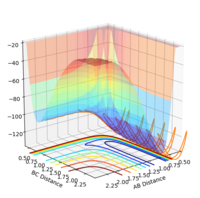
For H + HF -> H2 + F
The reaction is endothermic. Looking at the potential energy surface plot, as the HF molecule approaches hydrogen, the molecule has a lot of vibrational energy. As the reactants turn to products, the energy of the system increases. Energy must be put into the system in order to bring about a chemical change. As a result, the product molecule vibrates with less energy than the reactants as energy cannot be created or destroyed (The 1st Law of Thermodynamics). The reaction leads to less stable products requiring energy as the HF bond is strong and will not dissociate without input of energy.
Mm10114 (talk) 19:06, 14 May 2018 (BST) Your attempt at explaining both reactions is good. You should've only analyse the potential energy surface (position of the reactants/products on the potential energy surface and the relative energy difference of the two minima), not the reaction trajectories (as you often mention the vibrational energy, that will mostly depend on the momenta and initial conditions).
Locate the approximate position of the transition state.
The transition state for F + H2 -> HF + H is located at r1=1.8106 and r2=0.745. For the backwards reaction, the transition state will be located at r1=0.745 and r2=1.8106.
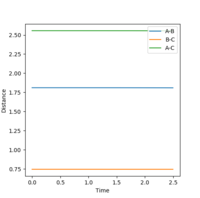
Mm10114 (talk) 19:06, 14 May 2018 (BST) How did you obtain these values? You lack the description of the whole procedure you used to find the transition state. You add a figure, but you forget to analyse it. How did it help you to locate the transition state? What does the plot represent?
Report the activation energy for both reactions.
The activation energy for F + H2 -> HF + H is equal to 0.196 Kcal/mol. The activation energy for H + HF -> H2 + F is equal to 30.24 Kcal/mol.
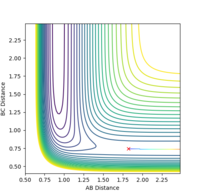
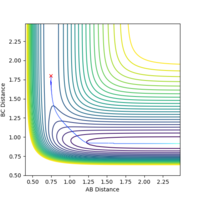
The activation energy is calculated using the energy of the transition state minus the energy of the reactants, therefore an mep calculation was carried out from the transition state to find the activation energies.
Mm10114 (talk) 19:06, 14 May 2018 (BST) In terms of the activiation energies which reaction is more likely to occur?
In light of the fact that energy is conserved, discuss the mechanism of release of the reaction energy. How could this be confirmed experimentally?
In this reaction, there is a large increase in stability of products relative to reactants. The decrease in potential energy is translated into the increase in kinetic energy as overall energy must be conserved. This can be observed in the momenta vs time plot, where proceeding the transition state, a large increase in vibration of the products is displayed.
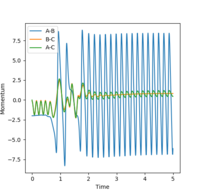
Mm10114 (talk) 19:06, 14 May 2018 (BST) You should specify which reaction are you describing. You don't attempt to answer the second question about experimental confirmation.
Discuss how the distribution of energy between different modes (translation and vibration) affect the efficiency of the reaction, and how this is influenced by the position of the transition state.
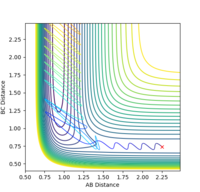
For H2 + F, the transition state is very close in energy to the reactants. Little energy is required to break the bond and form HF. Therefore, low vibrational momentum (0.01) and slightly higher translational motion (-1) will lead to successful reaction.
Mm10114 (talk) 19:06, 14 May 2018 (BST) Is it the energy required to break the bond the reason a "low vibrational momentum and slightly higher translational motion will lead to successful reaction"?
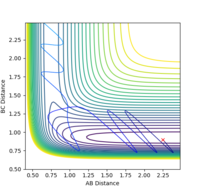
For HF + H, the transition state is close in energy to the products. A large energy barrier must be overcome in order to lead to a successful reaction. Therefore, a high vibrational momentum (-10) and relatively low translational motion (-1) is required to break the strong HF bond, forming H2.
Mm10114 (talk) 19:06, 14 May 2018 (BST) Same here. Are you sure that the fact the "large energy barrier must be overcome" is the reason "a high vibrational momentum (-10) and relatively low translational motion (-1) is required to break the strong HF bond"?
These reactions follow Polanyi's empirical rules.
Mm10114 (talk) 19:06, 14 May 2018 (BST) I think you should first reference the Polanyi's rules here. I think it would then help you to draw conclusions from the two plots you have just discussed. Yes, there will be some energy requirement to overcome the barriers in both cases, however from the Polanyi's rules a different picture arises why in the first example the higher translational motion results in reaction and why in the second example a high vibrational momentum is necessary for a reaction to occur, and this does not relate to the barrier height.
- ↑ R. D. Levine,Molecular Reaction Dynamics, Cambridge University Press, 2005

