MRD:gianpiero
(Whilst we don't strictly ask for an intro and a conclusion, it would've been nice to see at least some sort of structural elements, e.g. headers and a table of contents. Remember: You're writing a wiki entry after all. Fjs113 (talk) 16:40, 14 May 2018 (BST))
Q1:
At both a minimum and transition state the gradient will have a value of zero. The minima is an absolute minimum whilst the transition state is a saddle point. Using second derivatives will allow us to distinguish between the two; the second derivative at the transition state (saddle point) will give a positive and a negative value (representing the two orthogonal axes) whilst the second derivative at the minimum will give a single positive value.
(How can one derivative be both positive and negative? You need to mention partial derivatives as well as along which coordinates they take what values. Fjs113 (talk) 16:40, 14 May 2018 (BST))
Q2:
The transition state position can be determined using an Internuclear Distance vs Time plot which will give a straight line at the transition state distance due to a lack of internuclear oscillations. The calculated value was rts = 0.9079 a.u.
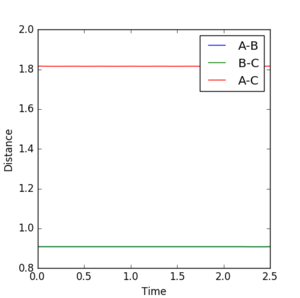
(Why does the transition state lack oscillations? Also, how was the value calculated? A little more in-depth explanation would've shown understanding. Fjs113 (talk) 16:40, 14 May 2018 (BST))
Q3:
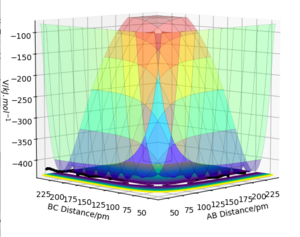
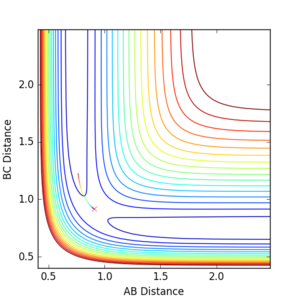
MEP calculations gave a flat line with zero momentum whilst the dynamics calculation gave a reaction path that shows oscillations. So whilst the MEP shows the most direct path to the transition state, the dynamics calculation gives us an insight into molecular vibrations.
(No - the MEP is the path along the steepest descent on the PES, which is not the most direct path to the TS. In most cases, the MEP trajectory will move away from the TS, as the TS is an unstable stationary point. Fjs113 (talk) 16:40, 14 May 2018 (BST))
Q4:
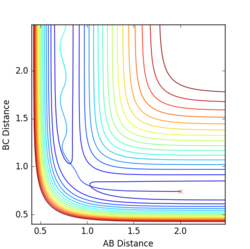
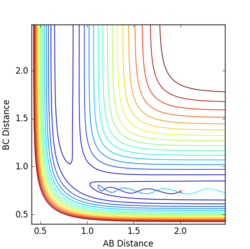
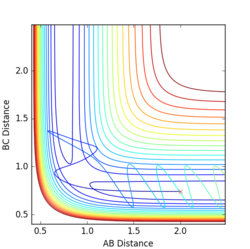
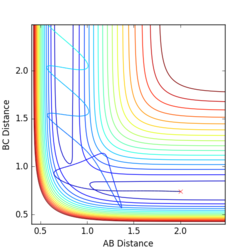
| p1 | p2 | E | R/U | |
|---|---|---|---|---|
| 1 | -1.25 | -2.5 | -99.018 | R |
| 2 | -1.5 | -2.0 | -100.456 | U |
| 3 | -1.5 | -2.5 | -98.956 | R |
| 4 | -2.5 | -5.0 | -84.956 | U |
| 5 | -2.5 | -5.2 | -83.416 | R |

Q5:
The main assumption of transition theory is that the transition state is in equilibrium with the reactants and products (Quasi-equilibrium assumption)[1]. It is thus assumed that the rates of formation of the transition state from both reactant collisions and product degradation are equal. The theory also assumes that the reaction always proceeds via the lowest enrgy saddle point, but this is not always the case (especially at higher temperatures).
(Is the quasi-equilibrium assumption useful in this case? We're look at a triatomic system in isolation instead of a statistical ensemble. Fjs113 (talk) 16:40, 14 May 2018 (BST))
For the results obtained here, we would expect transition state theory to give lower rates of conversion than experimental values, simply because the systems are not in true equilibrium.
(Unfortunately wrong: The main assumption of TST is to not take barrier re-crossing into account. You can see this effect happening in the last two cases in the previous question. The non-recrossing condition will lead to a higher predicted reaction rate. Fjs113 (talk) 16:40, 14 May 2018 (BST))
Q6:
The reaction between hydrogen and F is exothermic and thus the reverse reaction is endothermic. This is in direct relation to bond strengths as the HF bond is stronger than the hydrogen bond; thus energy must be added to the system in order for the reverse reaction to occur.
(Please use the program to answer this question! Hint: look at the PES and notice the difference in potential energy in the reactant and product channels. Fjs113 (talk) 16:40, 14 May 2018 (BST))
Q7:
The transition state can be identified by varying the internuclear distances until straight lines are obtained on the Internuclear Distance vs Time plot. The H-H transition state distance was found to be 0.744 a.u. whilst the H-F transition state distance was found to be 1.812 a.u.
(Simply stating the values is not enough! How did you obtain these numbers? Show some evidence that this is indeed the TS, e.g. a distances vs time plot. Fjs113 (talk) 16:40, 14 May 2018 (BST))
Q8.
Perturbation of the transition state allows for calculation of the activation energy. Using an energy vs time graph, whilst running an MEP calculation, gave an activation energy =0.283 kcal/mol for diatomic hydrogen reacting with fluorine. Whilst the reverse reaction was found to have an activation energy = 29.980 kcal/mol using the same procedure. This is consistent with our previous findings that the reverse reaction is endothermic (due to the strong HF bond) and thus requires more energy to overcome the activation barrier.
(Again, how were these values obtained? Bare numbers are meaningless without evidence produced by the simulation software. Fjs113 (talk) 16:40, 14 May 2018 (BST))
Q9:
A reactive set of initial conditions was determined: rF-H= 2.2, rH-H=0.84, pF-H=-0.75, pH-H=-1.5 a.u. It is evident, from the conservation of energy, that reaction energy is converted into vibrational energy upon formation of the products. IR analysis could be used to confirm this experimentally in which we would expect to see peaks corresponding to relaxation from the vibrationally excited state to the ground state.
(How were the initial conditions obtained? Please provide an explanation, even if it was just an educated gess. Regarding the experiment: This is a good start. Would've been nice if you elaborated a bit further. Fjs113 (talk) 16:40, 14 May 2018 (BST))
Q10.
The Polanyi rules state that vibrational energy is more efficient in promoting a late-barrier reaction than translational energy.[2] For the reaction of dihydrogen with F, we observe an early transition state which is similar in structure to the reactants. Conversely, the reverse reaction has a late transition state and hence is a more efficient reaction by Polanyi's rules.
(You should have supported this with some plots and elaboration how the different sets of initial conditions are consistent with Polanyi's rules. Fjs113 (talk) 16:40, 14 May 2018 (BST))
References
