
MRD:gc517
EXERCISE 1: H + H2 system
The Transition State

Figure 1 shows a potential energy surface with a transition state (circled in red) at the maximum point on the reaction path, the 'saddle point'. The oscillating line corresponds to the reaction pathway, showing the vibrations of both reactants and products. The transition state can be thought of as a ridge between two basins (the reactants and products). Mathematically, this point corresponds to the zero-gradient of the potential energy V, expressed in Equation 1.
-
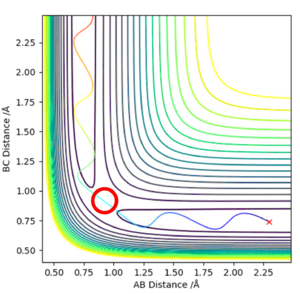 Figure 1 - A contour plot of the reaction with the transition state circled

How can the transition state be distinguished from other local minima? If a system of two coordinate vectors is considered, vector 2 lines up with the reaction direction and vector 1 is orthogonal to it, as shown in Figure 2.
-
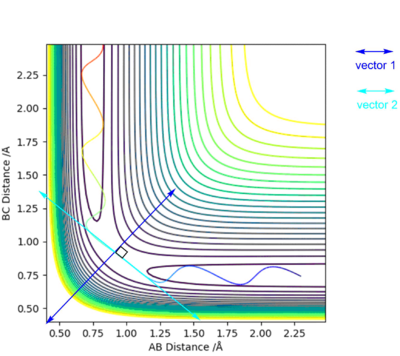 Figure 2 - A diagram of the system of vectors


Hence, the transition state is still a maximum along vector 2, but a minimum in the direction of vector 1. Therefore, the second derivatives with respect to the two vectors must be respectively negative and positive, according to Equation 2. good diagrams and clear explanation Pu12 (talk) 22:22, 16 May 2019 (BST)
In a symmetric surface, like the one for the H + H2, the transition state is also the point AB= BC. In the "Internuclear Distances VS Time" plot, this point corresponds to the intersection of the internuclear distances AB and BC. This point, circled in pink in Figure 3, was estimated to be at rts = 0.908 Å.
A trajectory starting from the TS and showing no energy change would be helpful here. Pu12 (talk) 22:22, 16 May 2019 (BST)
-
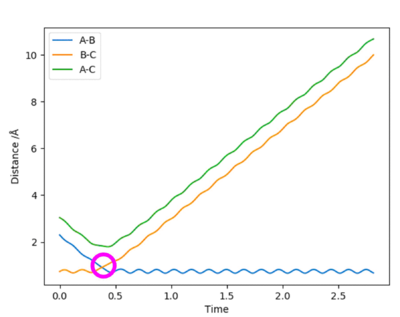 Figure 3 - "Internuclear Distance VS Time plot for the H + H2 system with the transition state at the intersection of the internuclear distances AB and BC

The Reaction Pathway
When the system is slightly displaced from the transition state (BC = 0.909 Å) and the initial momenta are set to zero, a trajectory starting from the transition state and going downhill to the products was observed. The trajectory was calculated both as a dynamic plot and a mep and two different behaviours of the reaction pathway were found. In the dynamic calculation (Figure 4), the pathway is wavy ie the molecule vibrates. In the case of the mep calculation (Figure 5), the molecule is not vibrating. When looking at the "Momenta Vs Time" plots for both calculations (Figure 6 and Figure 7), it can be clearly seen that in the dynamic calculation, there is some momentum ie velocity associated with the system, once it goes downhill to the products, whereas in the mep the momenta are maintained as zero.
-
 Figure 4- Dynamic Contour plot for the H + H2 system with trajectory from AB=rts, BC=rts+δ
 -
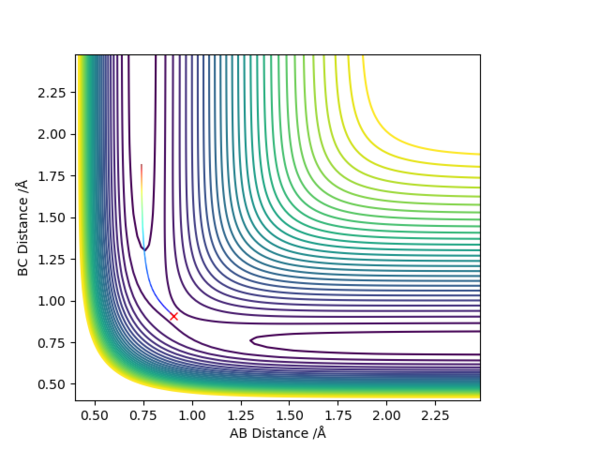 Figure 5 - MEP Contour plot for the H + H2 system with trajectory from AB=rts, BC=rts+δ


-
 Figure 6- Dynamic "Momenta VS Time" plot for the H + H2 system with trajectory from AB=rts, BC=rts+δ
 -
 Figure 7- MEP "Momenta VS Time" plot for the H + H2 system with trajectory from AB=rts, BC=rts+δ


Reactive and unreactive trajectories
| p1 | p2 | Etot | Reactive? | Description of the dynamics |
|---|---|---|---|---|
| -1.25 | -2.5 | -99.018 | Yes | 
HA approaches a non-vibrating H2 molecule. The result of the collision is a new vibrating molecule, as HC departs. |
| -1.5 | -2.0 | -100.456 | No | 
HA approaches a vibrating H2 molecule but it has insufficient kinetic energy to surmount the activation barrier (ie the saddle point), and the trajectory returns along the entrance channel to the reactants. |
| -1.5 | -2.5 | -98.956 | Yes | 
HA approaches a vibrating H2 molecule and results in the succesful formation of a new vibating molecule. |
| -2.5 | -5.0 | -84.956 | No | 
HA approaches a non-vibrating H2 molecule. The system is seen to cross the transition state region and initially form the prudct. However, because of an excess of kinetic energy, the system recrosses the barrier and goes back to the reactants channel. |
| -2.5 | -5.2 | -83.416 | Yes | 
HA approaches a non-vibrating H2 molecule. The system is seen to cross the transition state and yields, after some appreciable oscillations, a vibrating product molecule. |
This analysis shows that providing sufficient energy to the system is not enough alone to predict the successful outcome of the reaction, but the energy must also be in the right vibrational modes at the right time and this changes with changing momentum.
The rigorously correct way to calculate a reaction’s rate constant would involve these complex trajectory calculations from a complete PES. The complexity is overcome when the Transition State Theory (TST) 1 is considered. This approach requires a knowledge of the PES in the regions of the reactants and of the transition state.
The Transition State Theory (TST) considers a boundary surface passing through the hump of the PES - the (critical) dividing surface - and relies on some assumptions:
- al molecules that cross the dividing surface from the reactant side become products;
- during the reaction, the Boltzmann distribution of energy for the reactants is constant;
- molecules crossing the critical surface from the reactant side have a Boltzmann distribution of energy corresponding to the temperature of the reacting system.
It follows that this theory, especially according to the first assumption, would have not predicted the barrier recrossing case.
you should mention that the rate would be overestimated because of the assumptions, otherwise all good.Pu12 (talk) 22:22, 16 May 2019 (BST)
EXERCISE 2: F - H - H system
The PES and the Transition State
According to Hammond's postulate, the TS resembles the species neighbouring its energy along the reaction coordinate. This means that in an endothermic reaction, the TS resembles the products, whereas in an exothermic reaction it will resemble the reactants. For this system, the known length of the H-H bond (0.74 Å) was used as a starting condition and a mep calculation was performed to optimize the parameters and locate the transition state of the reaction. A good estimate was found at H-H = 1.811 Å and H-F = 0.744 Å.
-
 Figure 8 - A contour plot of the estimated transition state for the F-H-H system
 -
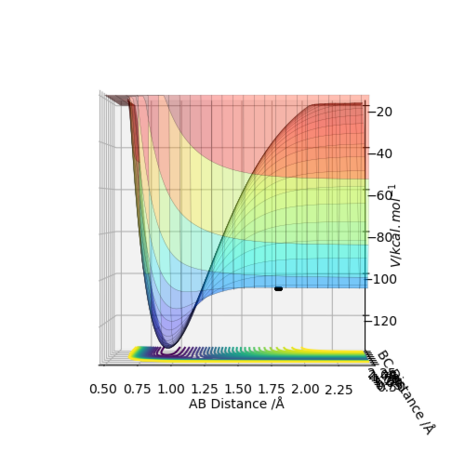 Figure 9 - A surface plot of the estimated transition state for the F-H-H system


By inspecting the potential energy surface (Figure 10 and Figure 11), the forward reaction - which corresponds to H2 + F - is exothermic ie the product side is lower in energy than the reactants side, whereas the backward reaction - HF + H- is endothermic. This agrees with the expectations since the H-F bond is stronger and its enthalpy of formation is more negative than the enthalpy of dissociation of H-H. For the same reason, to undergo the reverse reaction, ie the formation of the weak H-H bond from the strong H-F bond, the system requires to take energy from the surrounding.
-
 Figure 10 - A surface plot of the F-H-H system with the forward exothermic reaction highlighted
 -
 Figure 11 - A surface plot of the F-H-H system with the backward exothermic reaction highlighted


nice diagrams Pu12 (talk) 22:22, 16 May 2019 (BST)
The Activation Energy
With the system slightly displaced from the transition state in both directions and the initial momenta set to zero, a mep calculation was carried out and the "Energy VS Time" plot (Figure 12 and Figure 13) was used to extract the activation energy of the reactions.
-
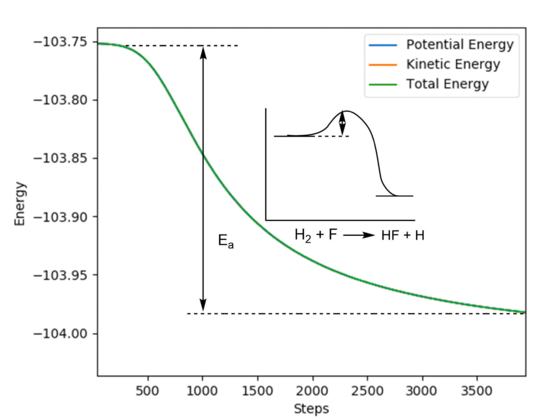 Figure 10 - A "Energy VS Time" plot of the H2 + F reaction with its activation energy
 -
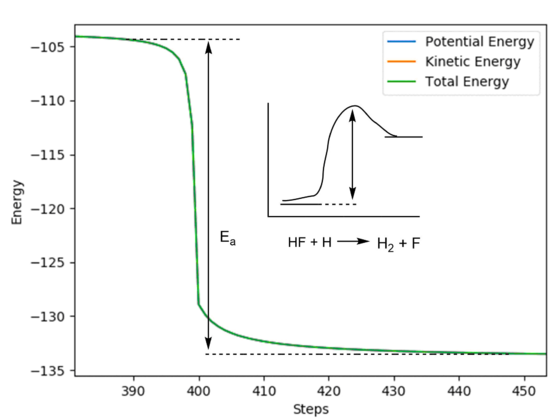 Figure 11 - A "Energy VS Time" plot of the HF + F reaction with its activation energy


Ea for H2 + F = -103.7 - (-103.90) ≈ 0.2 kcal/mol.
Ea for HF + H = -105 - (-133) ≈ 28 kcal/mol.
Reaction Dynamics
| RFH | RHH | pFH | pHH |
|---|---|---|---|
| 2.25 | 0.74 | -0.8 | -0.6 |
-
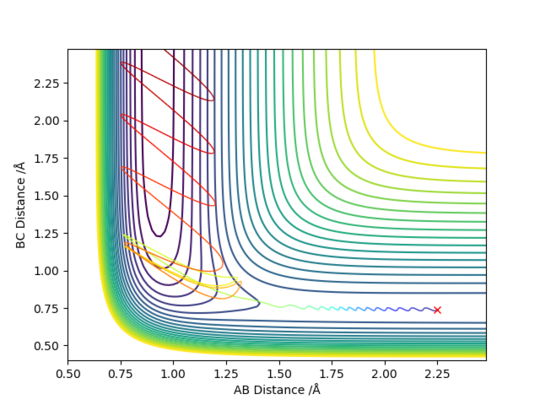 Figure 10 - A contour plot of a reactive trajectory for the F-H-H system
 -
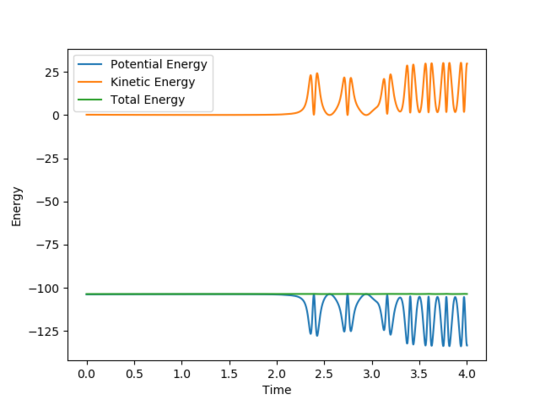 Figure 11 - A "Energy VS Time" plot of a reactive trajectory for the F-H-H system


In this reactive trajectory for F + H2, it can be observed that even for low values of momenta - a low vibrating molecule - a highly vibrating H-F molecule is obtained. For an exothermic reaction like this - where the products are lower in energy than the reactants - it means that the potential energy is converted into thermal energy ie vibrational energy. Experimentally, this can be probed with calorimetry.
F + H2 --> HF + F
A calculation starting on the side of the reactants - F + H2 - was set, with a pFH = -0.5 and changing values of pHH in the range -3 to 3.
| RFH | RHH | pFH | pHH | Reaction dynamics |
|---|---|---|---|---|
| 2.25 | 0.74 | -0.5 | -0.8 | 
|
| 2.25 | 0.74 | -0.5 | 1.3 | 
|
| -2.5 | 0.74 | -0.5 | 2.0 | 
|
| -2.5 | 0.74 | -0.5 | -2.9 | 
|
| -2.5 | 0.74 | -0.8 | 0.1 | 
|
From the runs, it can be observed that when pFH=-0.5, low values of pHH (e.g. -0.8) were not enough for the system to react. Higher values of momenta lead to a successful reaction. However, in the last case, even with a very low value of pHH, the calculated trajectory was successful as a result of the increase in pFH ie the translational energy of the collision.
HF + F --> F + H2
| RFH | RHH | pFH | pHH | Reaction dynamics |
|---|---|---|---|---|
| 0.91 | 2.25 | 0.5 | -5 | 
|
| 0.91 | 2.25 | 8 | -0.465 | 
|
From these runs, it was observed that for low pFH (low vibrations of HF), even a high pHH (high translational energy of the H atom) does not result into a successful reaction. In the second case, when the energy is provided to the system in the form of vibrational energy, even at low pHH, the reaction happened.
This part isn't necessary to show in the wiki as it isn't blue, but well done for showing it anyway as it helps with the next question and you have displayed it well. Pu12 (talk) 22:22, 16 May 2019 (BST)
Polanyi's rules 2
For a reaction to happen, enough energy to overcome the activation energy barrier must be provided to the system. The calculations above show that not always higher momenta result in a successful reaction. Polanyi's rules are a way to look at triatomic systems. They state that for an exothermic reaction - early transition state - energy must be mostly provided in the form of translational energy, whereas for an endothermic reaction - late transition state, energy must be mostly provided in the form of vibrational energy. F + H2 --> HF + F is an example of an exothermic reaction and, according to Hammond's postulate, it has an early transition state. Polanyi's rules for this reaction would generally predict a successful outcome for increasing values of translational energy, with a low- vibrating molecule. The results obtained generally agree with this pattern except for the 4th run, where the reaction was successful for a low value of pFH and a high value of pHH. In the case of the endothermic reaction HF + F --> F + H2, where the transition state is early, the values obtained in the calculations agree with the empirical rules.
This is a top tier report, good jobPu12 (talk) 22:22, 16 May 2019 (BST)
Bibliography
[1] I. N. Levine, Physical Chemistry, McGraw-Hill, 6th edition, 2009, ch. 22.
[2] J. C. Polanyi and W. H. Wong, J. Chem. Phys., 1969, 51(4), pp 1439-1450.