MRD:gab116
EXERCISE 1: H + H2 system
What value do the different components of the gradient of the potential energy surface have at a minimum and at a transition structure? Briefly explain how minima and transition structures can be distinguished using the curvature of the potential energy surface.
Along the reactant channel, the minimum has the property that ∂V(r1)/∂r1=0, and along the product channel, the minimum has the property that ∂V(r2)/∂r2=0. At the transition structure, ∂2V(ri)/∂ri2 < 0, whereas for the minima channels, ∂2V(ri)/∂ri2 = 0.
Ng611 (talk) 15:29, 1 June 2018 (BST) What do r1 and r2 represent here?
Minima exist as channels along the potential energy surface while the transition structure exists as a saddle point, which is a minimum in one orientation and is a maximum along the orthogonal orientation.
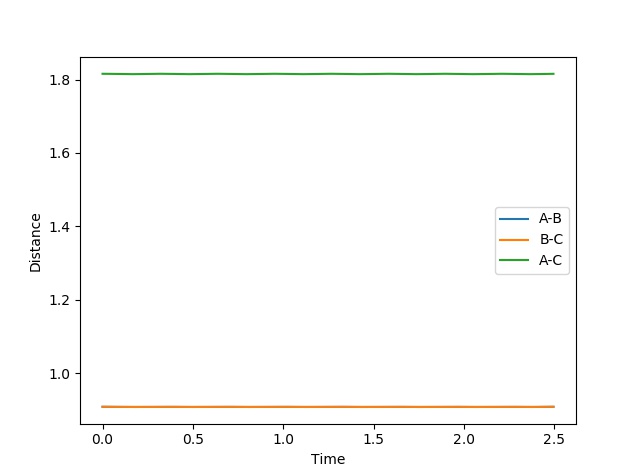
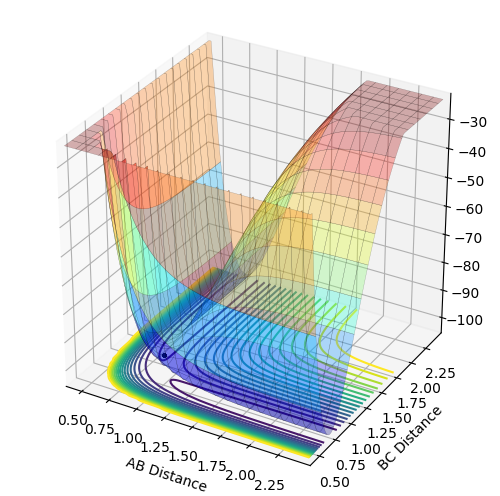
Report your best estimate of the transition state position (rts) and explain your reasoning illustrating it with a “Internuclear Distances vs Time” plot for a relevant trajectory.
The transition state position = 0.908 Å. This position gives the expected “Internuclear Distances vs Time” plot, where A-B equals B-C throughout and the plots completely overlap and do not oscillate. The potential energy surface plot also supports this value, as the trajectory does not oscillate but just exists as a stationary point at the saddle.
|
|
| Internuclear Distances vs Time | Potential Energy Surface |
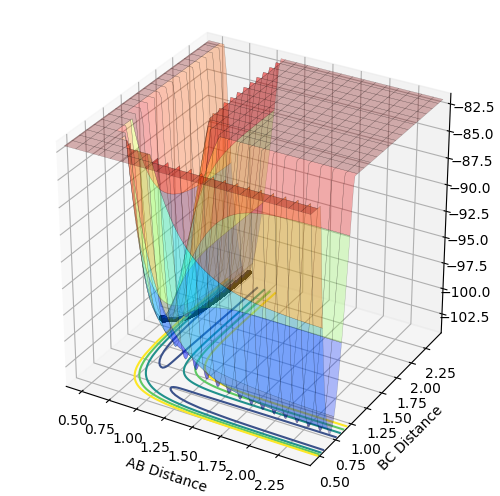
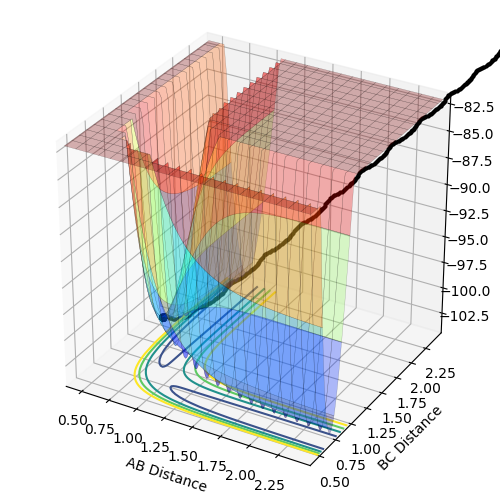
Comment on how the mep and the trajectory you just calculated differ.
The minimum energy path (mep) shows the trajectory with infinitely slow motion, where the velocity always reset to zero in each time step and hence there is no momentum or oscillation. The dynamics trajectory oscillates as the atoms still possess momentum.
|
|
| MEP | Dynamics |
Complete the table by adding a column with the total energy, and another column reporting if the trajectory is reactive or unreactive. For each set of initial conditions, provide a plot of the trajectory and a small description for what happens along the trajectory.
The initial positions: r1 = 0.74 and r2 = 2.0
| Experiment number | p1 | p2 | total energy/ kcal mol-1 | reactive or unreactive |
|---|---|---|---|---|
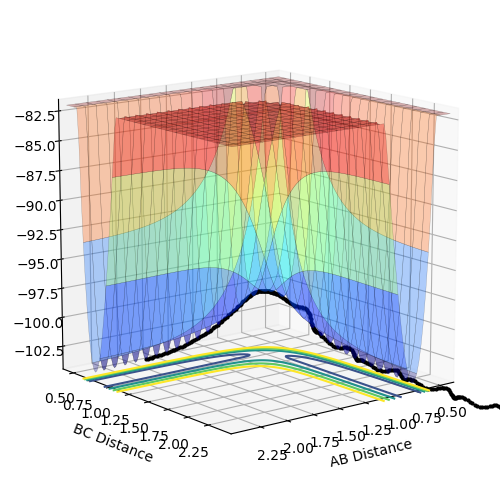
| 1 | -1.25 | -2.5 | -99.018 | reactive |
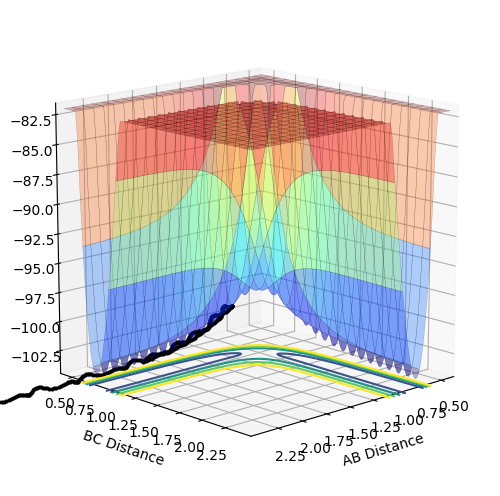
| 2 | -1.5 | -2.0 | -100.456 | unreactive |
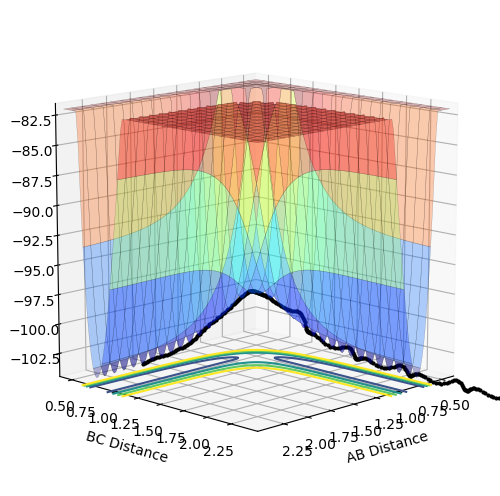
| 3 | -1.5 | -2.5 | -98.956 | reactive |
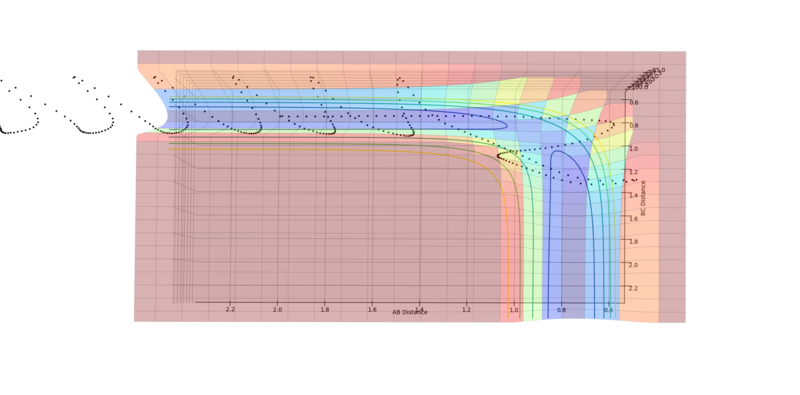
| 4 | -2.5 | -5.0 | -84.956 | unreactive |
| 5 | -2.5 | -5.2 | -83.416 | reactive |
Experiment 1
|
The momentum p2 is large enough so that the trajectory reaches and goes beyond the transition structure, leading to a successful reaction.
Experiment 2
|
The momentum p2 is not large enough and so the trajectory does not reach the transition structure, and hence there is no reaction.
Experiment 3
|
The momentum p2 is large enough so that the trajectory reaches and goes beyond the transition structure, leading to a successful reaction. However, as p1 here is greater in magnitude than the p1 in experiment 1 (for the same p2), the energy is less negative and hence the reaction is less favourable.
Experiment 4

|
|
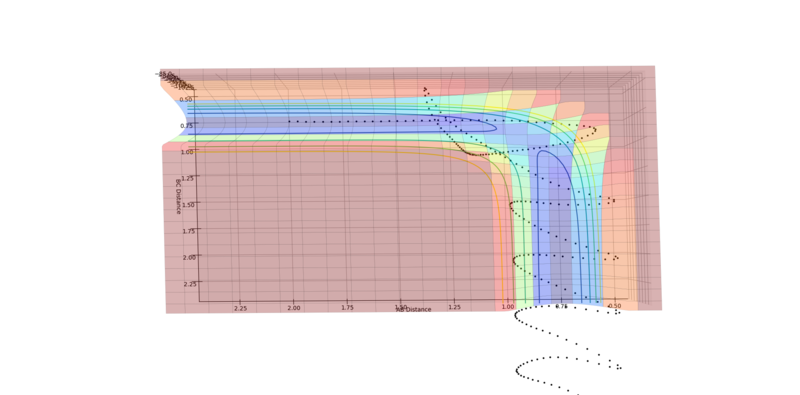
There is no reaction. Although the trajectory does reach the transition structure, the large oscillations cause the trajectory to overshoot and return back down the reactant channel, as can be seen from the second image.
Experiment 5

|
|
The reaction takes place. The trajectory initially reaches the transition structure but then falls back into the reaction channel, before rising again and surpassing the transition structure, leading to a reaction (see the second image). This is a result of the large oscillations that occur after the initial collision, which far outweigh the linear motion.
State what are the main assumptions of Transition State Theory. Given the results you have obtained, how will Transition State Theory predictions for reaction rate values compare with experimental values?
The main assumptions of Transition State Theory are1:
- Electronic and nuclear motion are separate.
- The reactant molecules are distributed among their states according to the Maxwell-Boltzmann distribution.
- In the transition state, motion along the reaction coordinate is treated as classical translation and is separate from other motion.
- The transition states that are becoming products are distributed among their states according to the Maxwell-Boltzmann distribution, even in the absence of an equilibrium between the reactant and product.
- Although some molecules that reach the transition state may revert to reactants, once they pass through it, they must form products.
The final assumption does not agree with what is observed in experiments 4 and 5. In experiment 4, the molecules pass into the product side of the transition state, but then return to the reactant side and so this experiment does obey the transition state theory. In experiment 5, the molecules pass into the product channel, go back into the reactant channel and finally return to the product channel, leading to the formation of the products, meaning that this experiment also does not obey the transition state theory.
As a result of this, it can be assumed that Transition State Theory predictions for reaction rate will not always agree with experimental values.
Ng611 (talk) 15:31, 1 June 2018 (BST) Absolutely correct. Will the discrepancy be an overestimation or underestimation on the part of TS theory? What about the effects of tunelling? Tunelling will play a minor role (much smaller that that of TS recrossing) but it should be mentioned.
EXERCISE 2: F - H - H system
Classify the F + H2 and H + HF reactions according to their energetics (endothermic or exothermic). How does this relate to the bond strength of the chemical species involved?
F + H2 is an exothermic reaction and H + HF is an endothermic reaction. This is a result of the H-F bond being stronger than the H-H bond (lit2: 565 kJ mol-1 compared to 436 kJ mol-1).
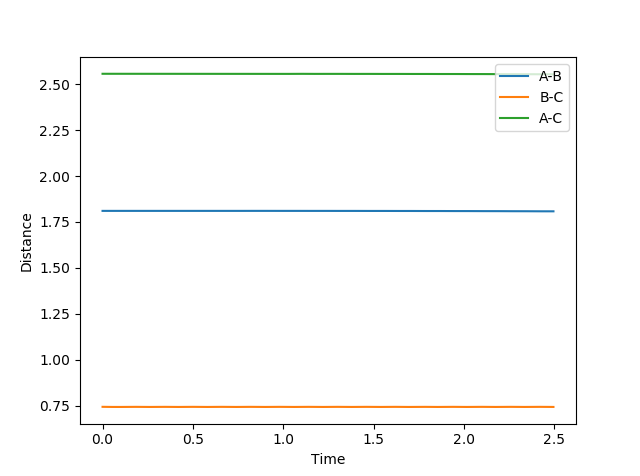
Locate the approximate position of the transition state.
rFH = 1.8104 Å and rHH = 0.7453 Å. This position gives the expected “Internuclear Distances vs Time” plot, where A-B and B-C are constant throughout and the plots do not oscillate. The potential energy surface plot also supports these bond distance values, as the trajectory exists as a stationary point.
|

|
| Internuclear Distances vs Time | Potential Energy Surface |
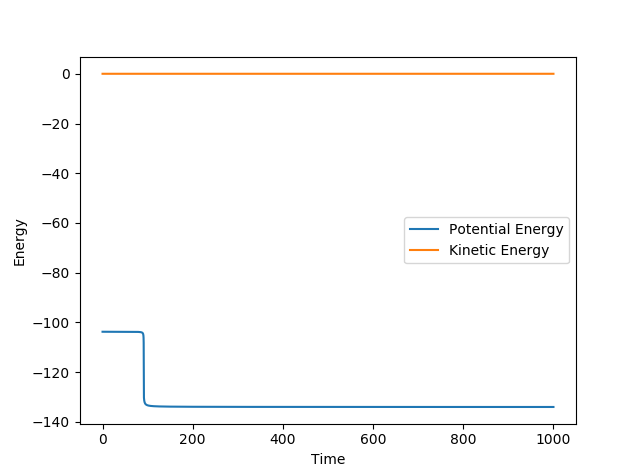
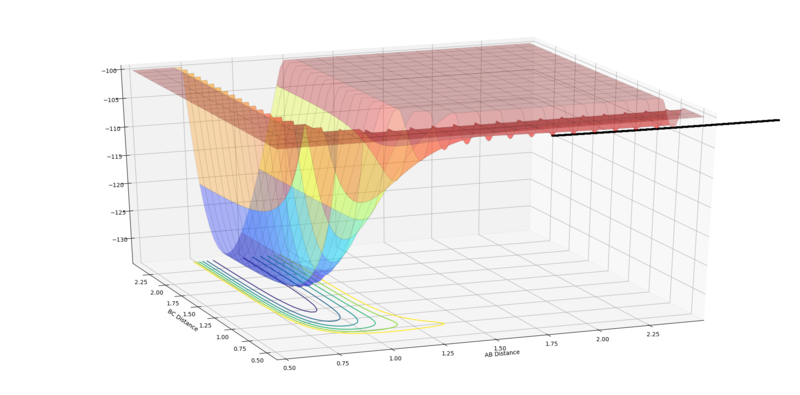
Report the activation energy for both reactions.
The values were obtained by performing a mep from a structure neighbouring the transition state.
For HF + H → HH +F : EA= 30.256 kcal mol-1
using rFH = 1.8 Å and rHH = 0.7453 Å

|
|
| Potential Energy Surface | Energy vs Time |
For HH + F → HF +H : EA= 0.238 kcal mol-1
Ng611 (talk) 15:33, 1 June 2018 (BST) Close, but you're off by a few kcal/mol. You actually have a slight residual gradient at the end of the simulation which suggests that the system hasn't yet reached the minimum. Think about how you could reach it/
using rFH = 1.9 Å and rHH = 0.7453 Å
|

|
| Potential Energy Surface | Energy vs Time |
In light of the fact that energy is conserved, discuss the mechanism of release of the reaction energy. How could this be confirmed experimentally?
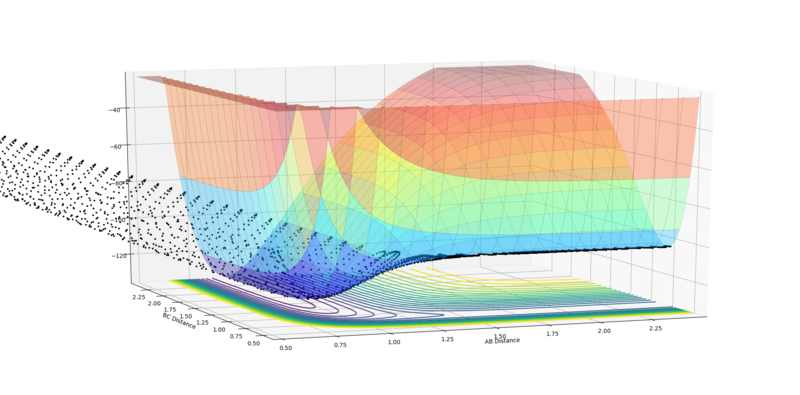
Initial conditions that results in a reactive trajectory for the F + H2:
rFH = 2.5 Å, rHH = 0.7453 Å, pFH = -0.8 and pHH = 0
|
| Reaction of F + H2 |
The reaction energy is released as the reaction path crosses the transition state and potential energy is converted to kinetic energy. The oscillations after the reaction are much stronger than the oscillations before, implying that significant amount of the kinetic energy has taken the form of vibrations in the resultant HF diatomic. Experimentally, if translational motion increases, one may expect a rise in pressure of the gas and hence a rise in temperature. Alternatively, if vibrational motion is affected, one may see a change in the EM radiation emitted in the IR region.
Ng611 (talk) 15:35, 1 June 2018 (BST) Good suggestion!
Discuss how the distribution of energy between different modes (translation and vibration) affect the efficiency of the reaction, and how this is influenced by the position of the transition state.
Polanyi's empirical rules state that early barriers are most efficiently overcome with translational energy. For late barrier reactions, vibrational energy is most efficient for a successful reaction.3 In this case, HH + F is an early transition barrier, since the barrier lies in the reactant channel, and HF + H is a late transition barrier, as the barrier lies in the product channel.
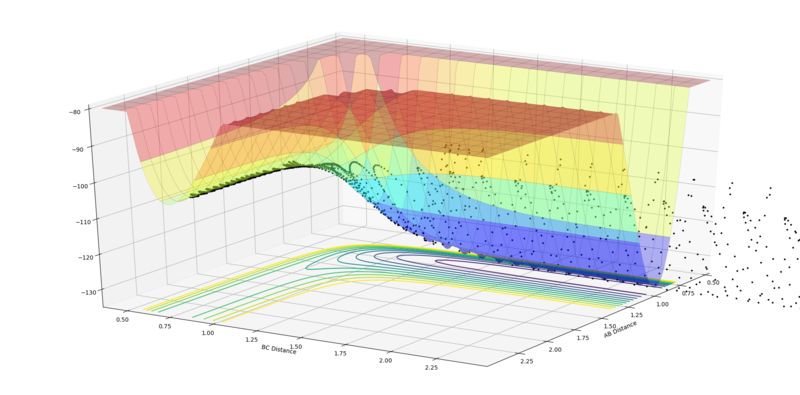
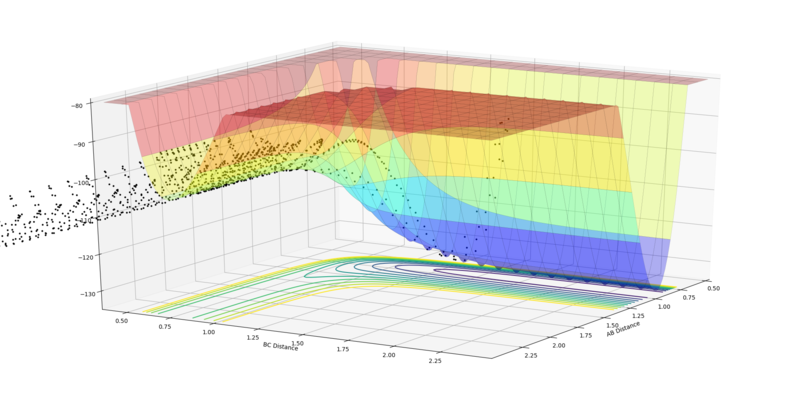
Early Barrier HH + F (rFH = 2.3 Å, rHH = 0.74 Å):
The first example below shows that a high translational:vibrational energy ratio favours reactions for early barrier systems. The second example shows a system with too much vibrational energy, leading to no reaction.
|
|
| High translation:vibration ratio, leading to reaction (pFH = -0.8 and pHH = 0.1). | Low translation:vibration ratio, leading to no reaction (pFH = -0.5 and pHH = 3). |
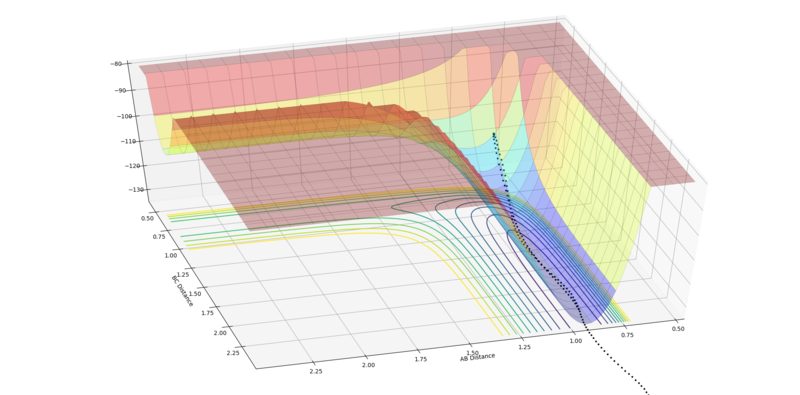
Late Barrier HF + H (rFH = 0.91 Å, rHH = 2.3 Å):
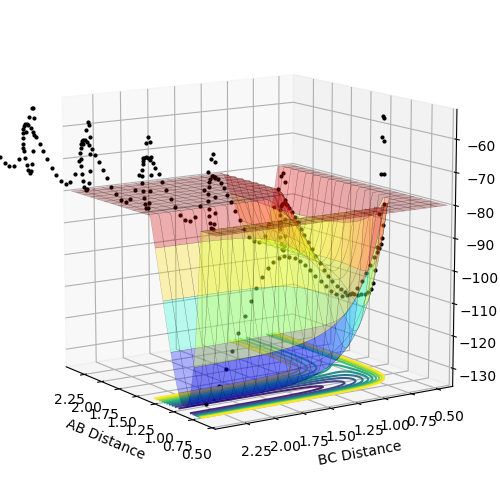
The first example below shows that a high translational:vibrational energy ratio leads to no reaction, as the system simply bounces off the wall opposite the reaction channel and doesn't oscillate enough for the system to turn into the product channel and pass the transition state. The second example shows a system with a high vibrational:translational energy ratio, which favours reactions for late barrier systems, leading to a successful reaction.
|
|
| Low vibration:translation ratio, leading to no reaction (pFH = -7 and pHH = -7). | High vibration:translation ratio, leading to reaction (pFH = 0.1 and pHH = -9). |
These cases all agree with Polanyi's rules: vibrational modes favour late barrier systems and translational modes favour early barrier system.
Ng611 (talk) 15:37, 1 June 2018 (BST) Good second section and good report overall. Well done! In future, try to structure your report more like a report, rather than just providing answers to the questions. However, the content was excellent -- well done.
References
- J. I. Steinfeld, J. S. Francisco and W. L. Hase, Chemical Kinetic and Dynamics, 1989, Prentice-Hall, 310-311.
- P. Atkins and J. de Paula, Physical Chemistry, 10th Edition, 2014, OUP, 986.
- J. I. Steinfeld, J. S. Francisco and W. L. Hase, Chemical Kinetic and Dynamics, 1989, Prentice-Hall, 297-299.
