MRD:fp1615 molecular reaction dynamics
Introduction
In this investigation, the software MatLab was used to calculate molecular dynamics trajectories in order to analyze the reactivity of triatomic systems in which an atom and a diatomic molecule collide. Reactions were simulated by describing the relative motion of the atoms, which can be approximated using the laws of classical mechanics as their mass is relatively large when compared to electrons.

Interatomic interactions, which affect the relative motion of the atoms and depend on their relative positions, can be expressed as a potential energy surface V(r1,r2...), a plot of the potential energy as a function of the relative positions coordinates ri, of all the atoms taking part in the reaction.[1] In an atom-diatom collision A + BC, the potential energy is a function of the three interatomic distances (or two distances and the angle between them or one distance and two angles). In order to simplify the analysis, the three atoms are constrained to be collinear (A-B-C) so that there are only two independent interatomic distances (AB and BC), with AC being equal the sum of the others.[2] The potential energy surfaces that are going to be examined are a plot of the potential as a function of these two coordinates and can be visualized in 3-dimensions using the software MatLab. The actual paths of the atoms during the encounter depends on the sum of kinetic and potential energy, but it is possible to obtain an idea of the paths available to the system by identifying paths that correspond to the least potential energy: the minimum energy path that leads from the reactants to the products is a trajectory defined as the reaction path or MEP.[2] On the other hand, a more realistic description of a reactive collision is the dynamics reaction path, which also takes into account atomic motion.[2]
The Transition State (TS)
The transition state is defined as the highest point along the minimal energy path, the saddle point: all the reactive trajectories must pass through it, while the ones that do not go directly over the saddle point do not result in a reaction.[2] This happens because the energy increases if at the saddle point we deviate sideways from the reaction coordinate, so all the trajectories that do not pass through it require a significantly higher total energy.[3]
At the transition structure, the value of the gradient of the potential energy surface is equal to zero, meaning that all the partial derivatives are equal to zero (∂V(ri)/∂ri=ƒri=0). However, also at a minimum the total gradient of the potential energy surface and thus all the partial derivatives are equal to zero. A minimum can be distinguished from a saddle point using the second derivative test discriminant: if ƒr1r1ƒr2r2 - ƒ2r1r2>0 at (a,b) then (a,b) is a saddle point (transition state), whereas if ƒr1r1ƒr2r2 - ƒ2r1r2<0 at (a,b) then (a,b) is either a maximum or a minimum.[4] In particular, a minimum is characterized by the fact that the second partial derivatives with respect to both coordinates are positive (ƒr1r1>0 and ƒr2r2>0) at (a,b).[4]

H - H - H System
The first system that is going to be analyzed is composed of three hydrogen atoms and the collision being studied is the one between a single H atom and a H2 molecule. It is important to state that for a given potential surface the positions r1(t),r2(t) and the momenta p1(t), p2(t) at time t are determined by the conditions at t=0 r1(0),r2(0) and p1(0), p2(0). Furthermore, a negative value of p corresponds to a velocity that decreases the interatomic distance.
This investigation will therefore examine the following collinear collision:H + H2 → H2 + H
[A=Hydrogen, B=Hydrogen, C=Hydrogen so the above reaction can also be written as BC + A → AB + C.]

Locating the Transition State in the H-H-H System
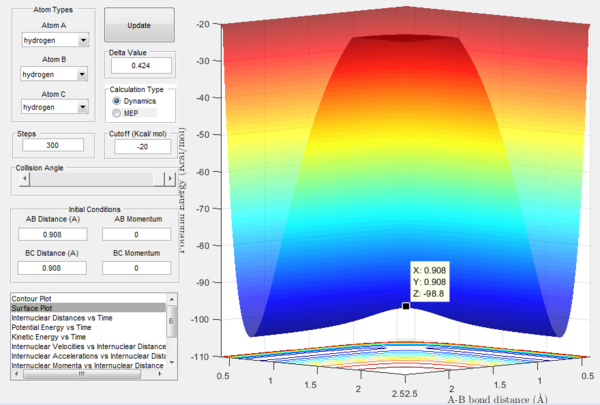
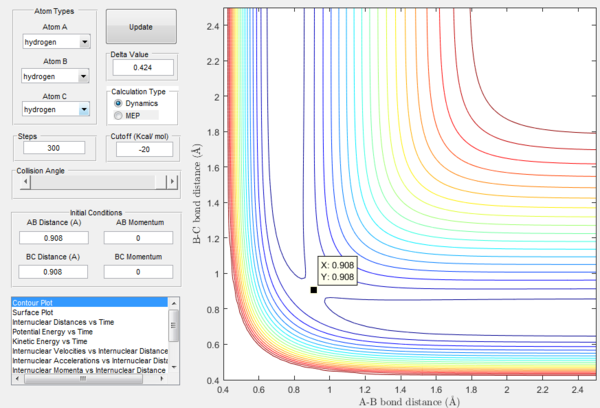
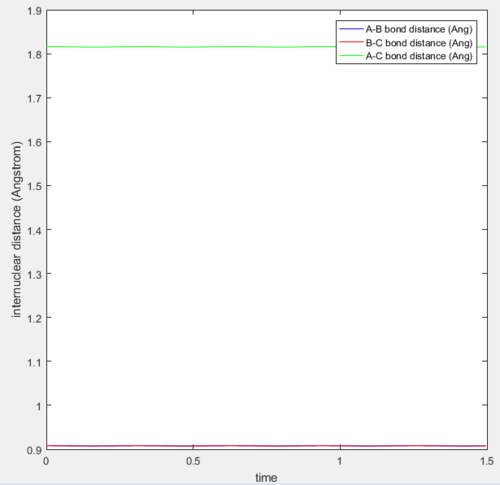
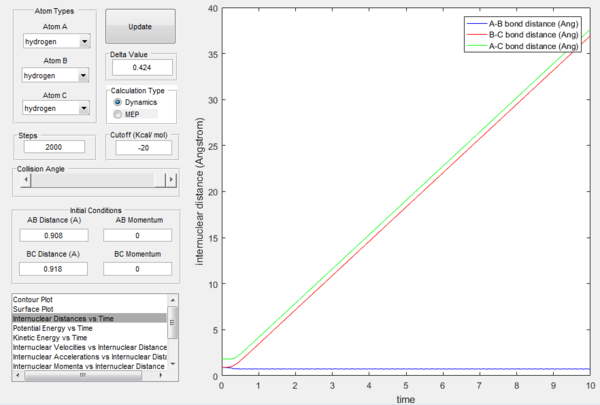
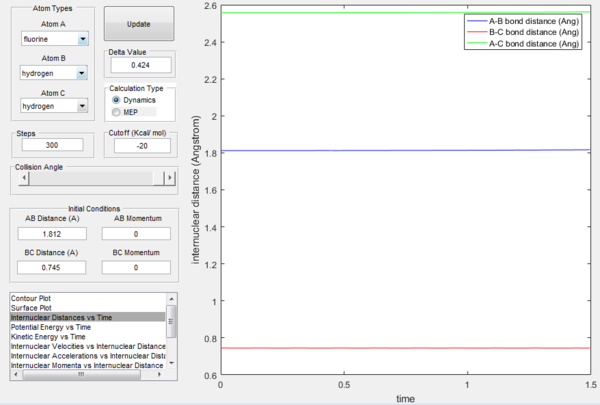
The potential energy surface of H + H2 is symmetric, so the transition state must have r1=r2: following this, the transition state was located by testing different initial conditions with rAB=rBC and pAB=pBC=0. The force acting on a given interatomic coordinate ri is the variation of momentum with time (dp/dt) and depends on the derivative of the potential energy surface with respect to that coordinate (dp/dt=-∂V(rAB,rBC)/∂ri): as explained above, at transition state the total gradient of the potential energy surface has to be equal to zero, so it follows that also the change in momentum has to be equal to zero.[1] Hence the best estimate of the transition state position is rts=0.908 Å, which was found by inspecting the internuclear distance vs time plot (Figure 4) for the different initial conditions tested: the position chosen was the one in which the internuclear distances appear as a straight line, indicating that the atoms have no momentum and are thus still; if the system is not perturbed the atoms will not move closer together nor will they move away from each other.
Trajectories from rBC = rts+δ, rAB = rts
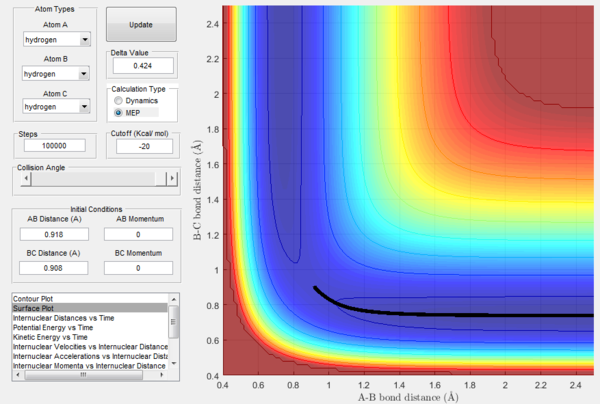
Once the transition state has been located, it is possible to analyze what happens when the system is slightly displaced from it. In order to do so, it is necessary to set the initial conditions as rBC = rts+0.01Å, r2AB = rts, which are rBC = 0.918 Å, rAB = 0.908 Å based on the previous findings. In addition to the dynamics energy path, also the minimum energy path (MEP), a trajectory in which the velocity always resets to zero at each step and that thus corresponds to infinitely slow motion, will be calculated. Although the MEP can be useful to characterize a chemical reaction, it does not describe a realistic motion because the atoms being studied are gaseous and possess a mass, so their motion is inertial.
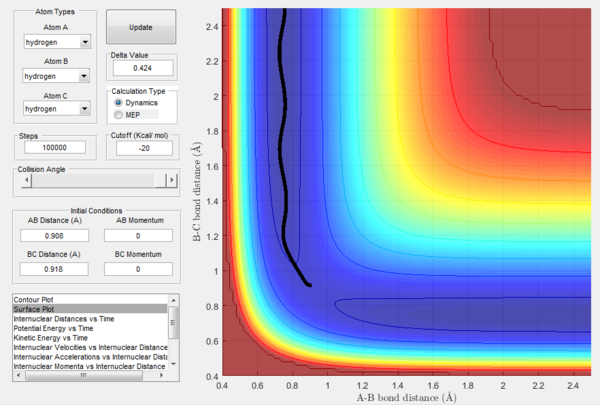
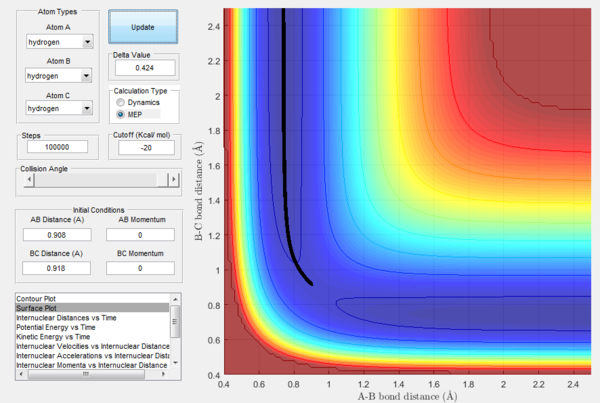
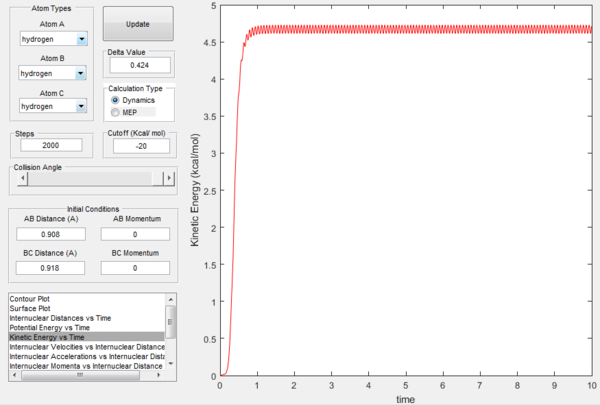
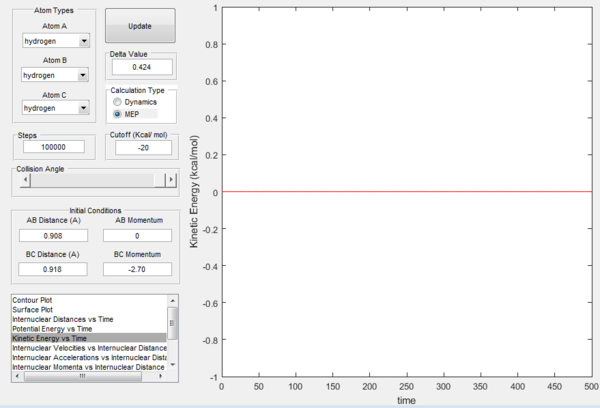
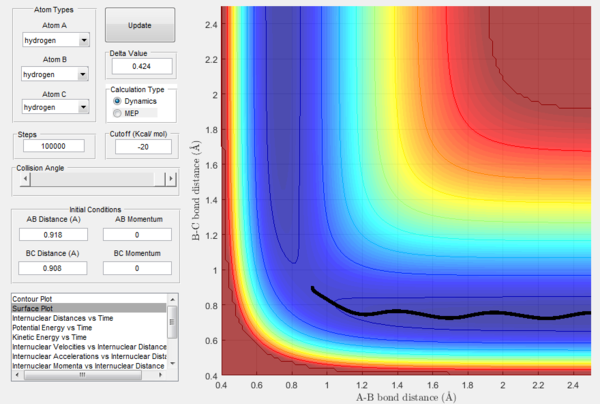
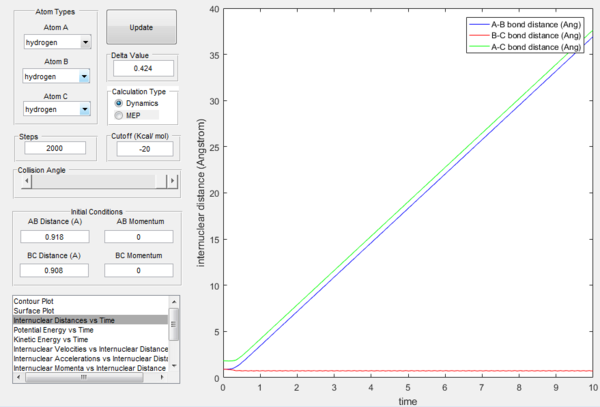
In Figures 7 and 8, it is possible to observe both the trajectory calculated according to dynamics and the one that corresponds to the minimum energy path (note that the number of steps has been increased to obtain a complete trajectory). In both cases, the trajectories follow the valley floor to the products H and H2 (AB + C); however, the latter differs from the first one because it is a straight line without any oscillation. As mentioned before, the MEP trajectory does not provide a realistic account as it does not take into account molecular and atomic motion: the kinetic energy vs time plot corresponding to the MEP is in fact a straight line at Ek=0 indicating that the atoms do not move (Figure 10). The wavy black line in the other calculated trajectory is in fact given by molecular and atomic vibrations and it is a more realistic account of what actually happens in a real collision, in which de destabilisation of the system due to the motion of the atoms plays a major role. An analysis of the kinetic energy vs time plot for the dynamics reaction path reveals that as the system is displaced from its transition state the kinetic energy increases quickly to then transform into vibrational energy of the new diatomic and reach a constant value around which it keeps oscillating (Figure 9)
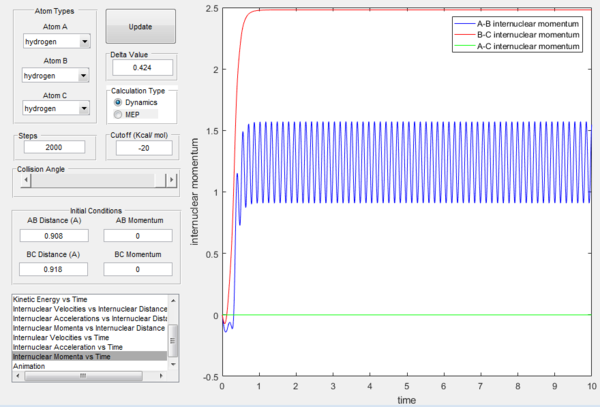
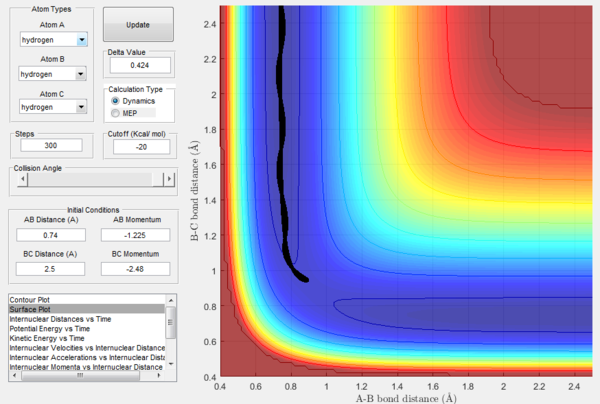
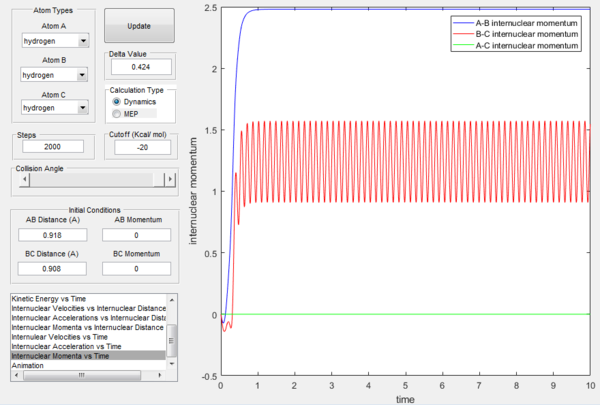
At t=1 the collision has occurred and the reaction has taken place. From the graphs above, it is possible to observe that at this time rAB=0.74 Å, the H2 bond distance, while the atom C has moved away from the system and rBC=2.5 Å. Due to the fact that at large t atom C is moving away from the product AB at constant velocity, also pBC=2.48 remains constant and is positive indicating that the interatomic distance is increasing. On the other hand, pAB oscillates between 1.55 and 0.90 with a mean value of 1.1225: the oscillation observed is caused by the molecular vibrations of the newly formed diatomic molecule AB.
If the above calculated final positions are set to be the initial positions and the values of momenta are inverted, the trajectory goes back to transition state and, if the system is provided with slightly more energy, it then overcomes the barrier and proceeds to the products. In fact, as the valley is discended the potential energy is converted to kinetic energy, and if this kinetic energy is supplied to the system in the opposite direction, the system then follows a trajectory that goes up to the transition state gaining again potential energy.
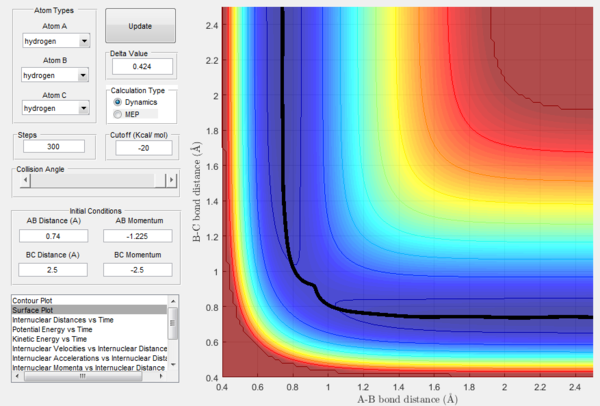
If dynamics and MEP trajectories are simulated analogously as before, but rAB is displaced from equilibrium (rAB=rTS+0.01 Å) instead of rBC (always keeping the initial momentum equal to zero), the trajectories will behave in the exact opposite way: the system will go back to the reactants (A+ BC) instead of proceeding to the products as in the previous case.
Reaction Dynamics: Reactivity of Different Trajectories
The shape of the potential energy surface can be investigated experimentally by changing the relative speed of approach of the molecules and the degree of vibrational excitation and observing whether a reaction occurs and the products are in a vibrationally excited state.[3] For the initial positions rBC=0.74 and rAC=2.0, trajectories were calculated with a set of momenta combinations to analyse how these affect the reactivity of the collisions.
Table 1. Different initial pBC and pAB at rBC=0.74 and rAB=2.0 to analyse how reactivity varies with initial momenta at fixed initial distances.
| pBC | pAB | Reactivity | Description of the Collision | |
|---|---|---|---|---|
| a | -1.25 | -2.5 | Reactive | A approaches the diatomic BC resulting in the formation of the AB bond and in C moving away from the newly formed diatomic. |
| b | -1.5 | -2.0 | Unreactive | A approaches the diatomic BC, but before the collision its momentum changes sign and A moves away from the diatomic. |
| c | -1.5 | -2.5 | Reactive | A approaches the diatomic BC resulting in the formation of the AB bond and in C moving away from the newly formed diatomic. |
| d | -2.5 | -5.0 | Unreactive | A approaches very quickly the diatomic BC and seems to have formed an AB bond with C moving away, but then C comes back and the system returns to the initial A+BC configuration. |
| e | -2.5 | -5.2 | Reactive | A approaches the diatomic BC and a symmetric ABC vibration follows for a while before C starts to move away from the newly formed bond AB. |

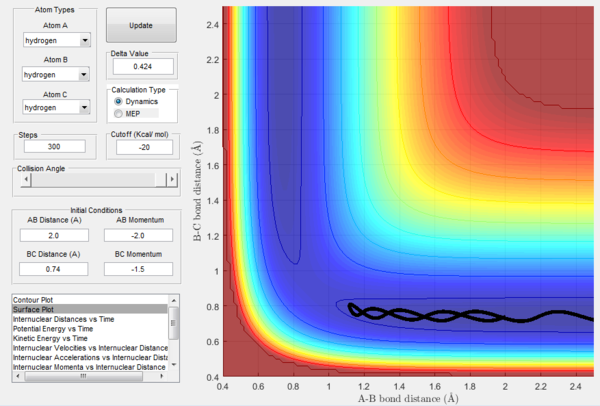
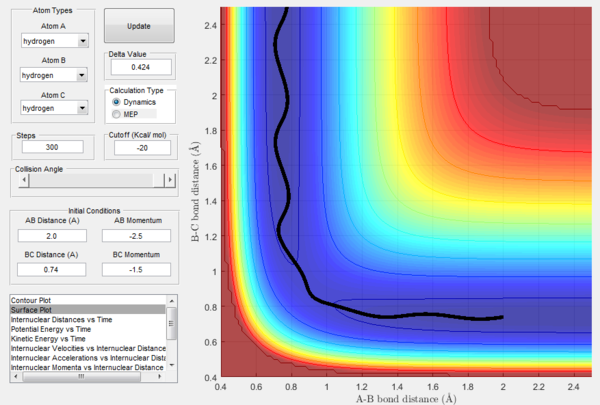
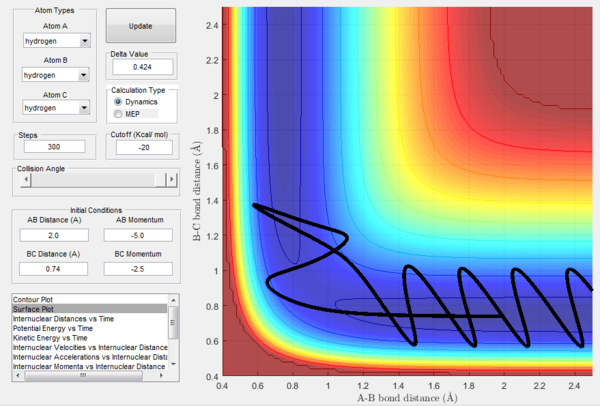
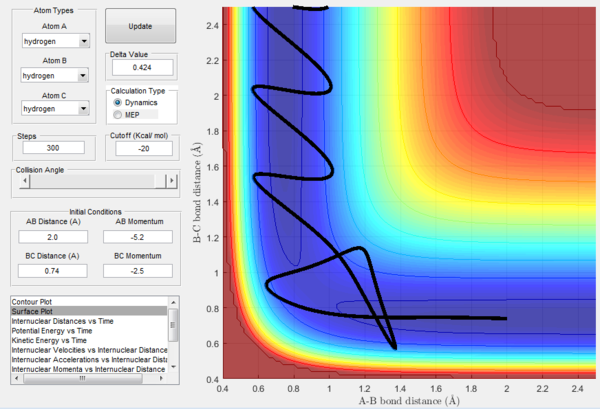
The above experimental data show that the assumption that if the system is provided with high enough overall energy than the collision will be reactive is not valid. In fact, reactivity of a certain trajectory depends on the ratio of the momenta provided at initial conditions and not on their overall value.
Transition State Theory
Transition state theory (TST) describes the reaction rates of elementary chemical reactions, assuming that there is a particular quasi-equilibrium between the reactants and the activated complex at transition state.[5] This theory is based on the assumption that atomic nuclei behave according to classical mechanics and that atomic motion on the potential energy hypersurface can be accurately described by classical mechanics laws[5]. Furthermore, TST assumes that at transition state the reaction coordinate degree of freedom can be separated from the rest and that there is no dynamic coupling between it and all the other degrees of freedom.[6] These assumptions are however a limitation of this theory that, especially in the case of a light particle such as a hydrogen atom, does not account for a realistic description of the reaction dynamics.
According to TST, any trajectory that reaches the transition state with infinitesimal kinetic energy in the direction of the products will go down the valley and proceed to the products.[6] This theory therefore predicts that when the barrier has been passed it is not possible to go back to the reactants side: however, experimental evidence (condition d in the above section) suggests that this prediction is wrong and that barrier recrossing can happen.[6]
The transition state theory also assumes that, in order to travel successfully from reactants to products, a molecule must pass through the exact transition state of the potential surface.[6] By looking at the reactive trajectories calculated in the previous section, it is possible to notice that none of them passes through the exact saddle point and that they all pass through a variety of locations around it, with no single location being dominant. A statistical perspective allows to understand that is very unlikely for a system to have the exact same energy as the activation energy, but is far more likely that the trajectory is slightly displaced resulting in the system to reach an energy higher than the value needed for the reaction to proceed.
In addition, TST does not take into account the fact that, according to quantum mechanics, particles can tunnel across barriers of finite energies so that there is the possibility that molecules react even if they do not collide with enough energy to climb the saddle point of the potential surface and cross the barrier (note that tunnelling increases with decreasing barrier height).[6]
In conclusion, TST could be used to gain a qualitative understanding of the system, but its limitations result in the fact that there are many conditions at which its predictions are not valid as shown in this investigation.
F - H - H System
H2 + F → HF + H
Fluorine=A, Hydrogen=B, Hydrogen=C so the reaction can also be written as BC + A → AB + C.
H2 + F → HF + H is an exothermic reaction and its inverse is instead an endothermic reaction, indicating that the H-F bond is stronger than the H-H bond because more energy is released when the H-F bond (product) is formed than it takes to break H2 (reactant). It is a very exoergic reaction, so the barrier occurs at an early stage and is very small; immediately after the barrier the potential energy instead drops rather steeply: since the exoergicity is released early along the reaction path, it is readily transformed into the vibrational motion of the newly formed bond: this is a typical example of an attractive potential energy surface.[2][3] Considering this a reversible reaction, it follows that the opposite reactionis characterised by a repulsive potential energy surface.[2]
Locating the Transition State in the F-H-H System
The Hammond's postulate states that in an exothermic reaction, the transition state is closer in energy to the reactants than to the products: knowing that F + H2 is an exothermic reaction, this postulate is used to locate the transition state.
The potential energy surface of this system is not symmetric as the previously examined one was, so at transition state rBC≠rAB. Knowing the approximate position of the saddle point (near the reactants), the exact transition state position can be found following the same procedure as in the H-H-H system, which consisted in finding the initial conditions that would result in the internuclear distance vs time plot being a straight line (momentum equal to 0). In this way, it was found that the approximate transition state of the system is at rAB= 1.812 Å and rBC= 0.745 Å.

Activation Energy
An inspection of the potential surface energy of the system also allows the determination of the activation energies for the reaction and its inverse. MEP trajectories at zero initial momentum were calculated slightly displacing the transition state rAB first in the direction of the reactants and then in the direction of products. Using these mimimum energy paths the most precise estimate of the activation energy possible was obtained by plotting a potential energy vs time graph.
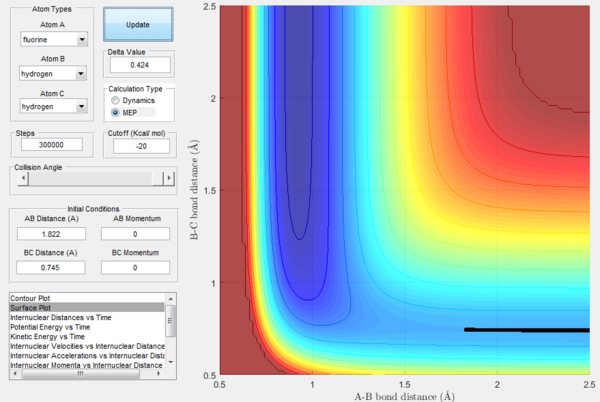
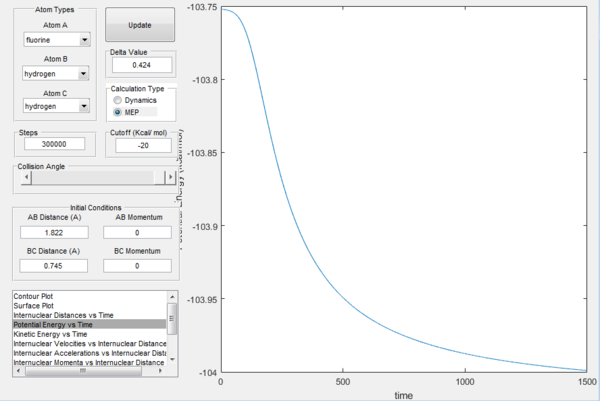
In the above pictures rAB was slightly displaced from transition state towards the reactants, so as it can be observed the trajectory starts from around the TS and goes down the valley to the reactants (H2 + F). At t=0 the potential energy is approximately equal to the potential energy at transition state (the displacement is very minor), then it goes down as the trajectory goes down the valley in the potential energy surface and it finally reaches a constant value, which is the potential energy of the reactants. The energy of the transition state is very close to the one of the reactants, so the gradient is very small and it would take infinite steps in a MEP simulation to actually reach a constant value. However, the potential energy value at t=1500 can be considered a good estimate. The difference in these two potential energies is the difference in energy between the reactants and the transition state, which is defined as the activation energy of the exothermic reaction H2 + F → HF + H and is equal to 0.244 kcal mol-1.
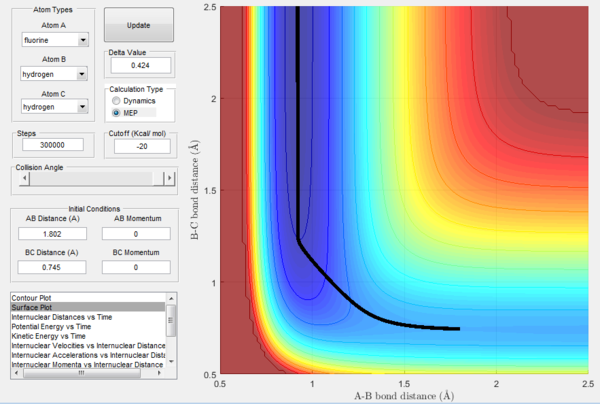
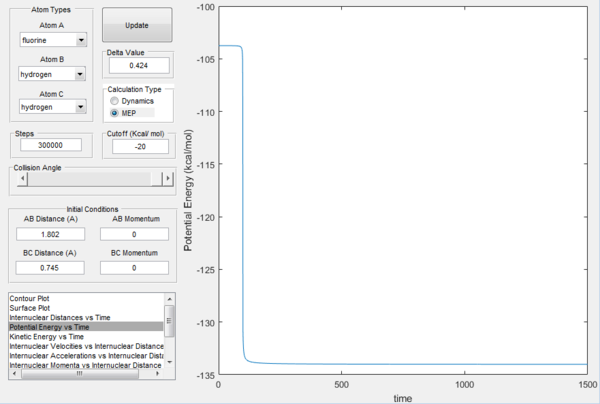
In a similar way, the above pictures show the MEP trajectory calculated when the transition state rAB is slightly displaced towards the products. It can be observed that the system is displaced from transition state to the products HF + H, so the difference in potential energy calculated from the potential energy vs time plot is defined as the activation energy for the endothermic reaction HF + H → H2 + F and is equal to 30.2 kcal mol-1. It is possible to notice that the change in potential energy is much steeper than the one from TS to reactants due to the fact that there is much more difference between the energy of the transition state and the energy of the products, which are far more stable than the reactants, resulting in the valley of the potential energy surface going down much faster and in the constant potential energy value for the products being reached much sooner.
The values calculated are approximations because the maximum potential energy is not taken as the exact transition state, but is taken from positions slightly displaced from it. At the same time, for the calculation of the activation energy of the exothermic reaction, the potential energy value of the reactants is just an estimate. The values calculated can however, be considered accurate to a good approximation and allow to gain an understanding of the energetics of the reaction.
Reaction Dynamics: Reactivity of Different Trajectories
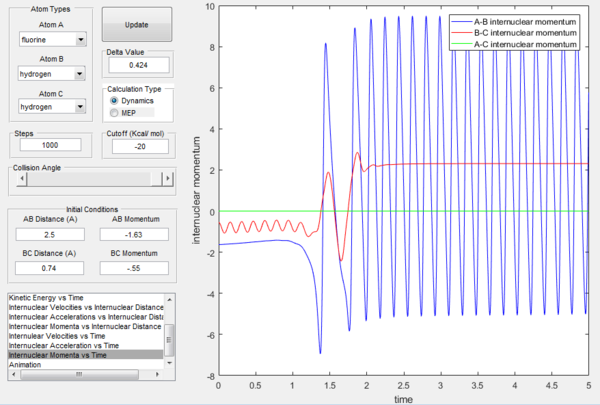
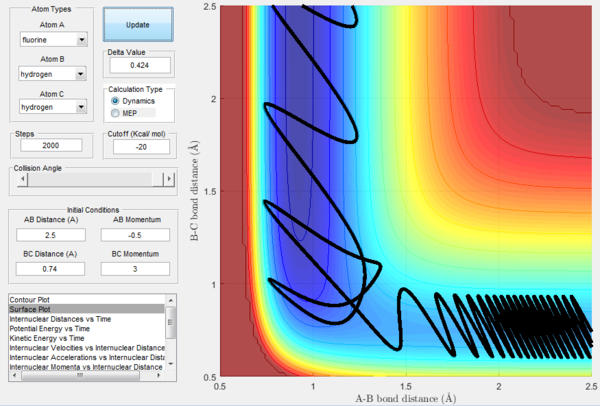
As previously observed in this report, it is wrong to assume that higher values of momenta necessarily correspond to the calculated trajectory to be reactive. In this section, a set of initial conditions that results in a reactive trajectory was identified and can be observed in the following figures: rAB= 2.5 Å, rBC= 0.74 Å (H2 bond length), pAB=-1.63, pBC=-0.55. For the H-H-H system a mathematical approach to the calculation of the initial momenta that lead to a reactive collision is more straightforward because all the three atoms possess the same mass. However, F has a mass that is around 19 times bigger than the one of hydrogen and this has to be taken into account. The internuclear momenta vs time plot in Figure 31 shows that before the reaction the diatomic BC possesses vibrational energy and the atom A possesses translational energy as it approaches the diatomic. After the collision the reaction energy is released as translational energy for the atom C that moves away from the system and vibrational energy for the AB molecule formed in the reaction, which is higher than the initial BC vibrational energy. In fact, the momenta pAC at large t oscillates around a constant value illustrating that the newly formed molecule AB is vibrating. This could be confirmed experimentally by vibrational spectroscopy (i.e. IR analysis).
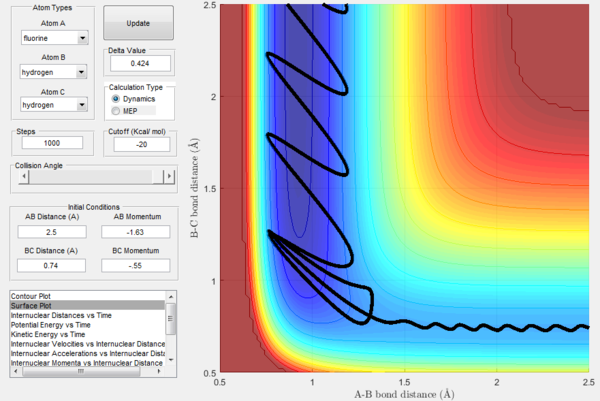
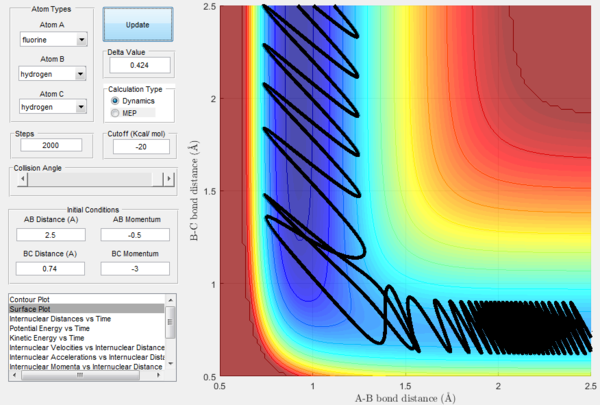
In order to further explore reactive trajectories in this system, different initial values of pBC ranging from -3 to 3 were tested for rBC=0.74 Å, rAB=2.5 Å and pAB=-0.5. At these conditions, much more energy than the activation energy is supplied to the system on the H2 vibration. As it is possible to observe in the Figures 32-44, the trajectories are reactive only for large values of pAB such as -3, 2.5 and 3. The larger the momentum, the more the initial diatomic molecule H2 vibrates. As it can be deduced from the following experimental data, if these vibrations are strong enough they eventually perturb the motion of the fluorine atom to an extent that it results in the collision and thus the reaction to occur.

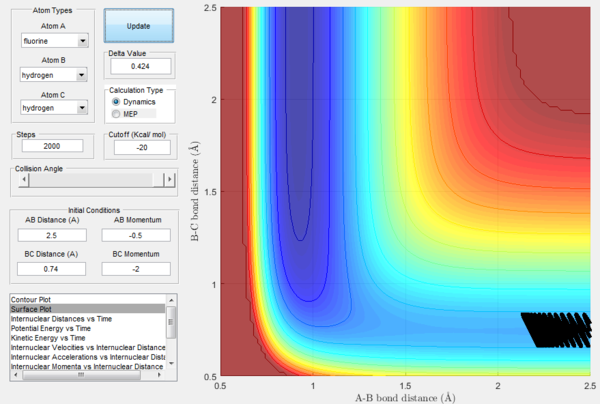

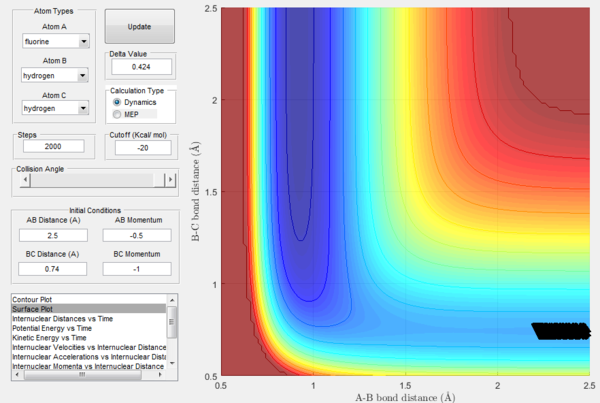

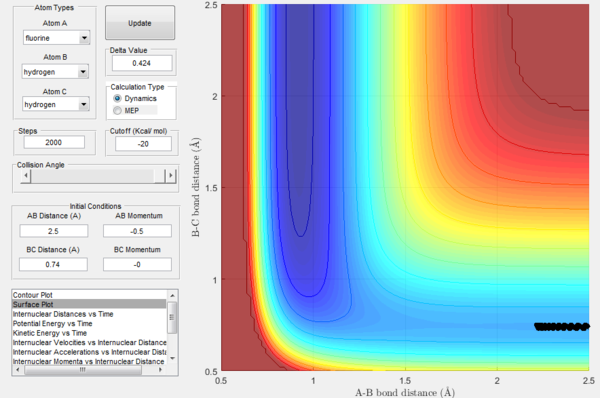


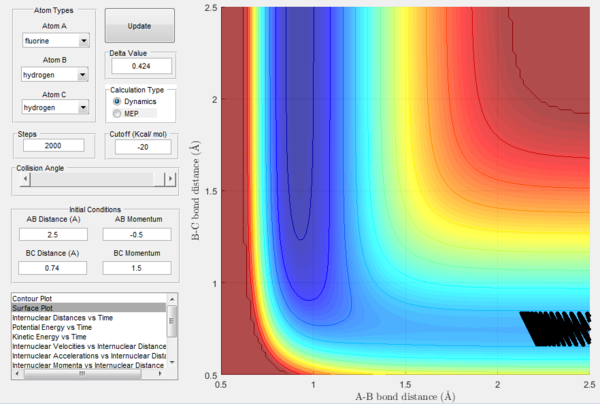

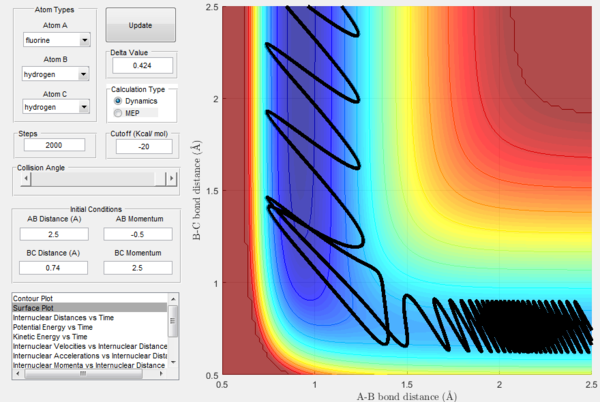
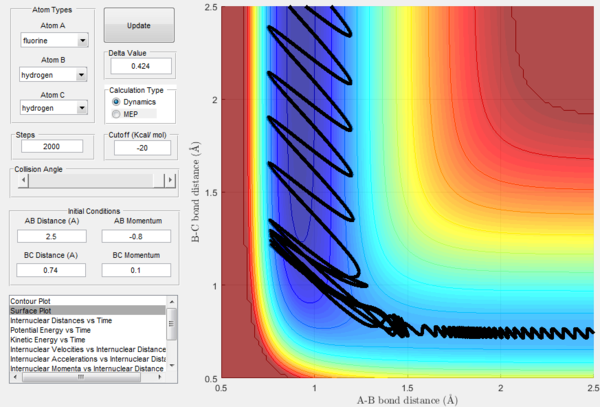
For the same initial positions, the initial momentum pAB was increased to -0.8 and the overall energy of the system was considerably reduced by reducing pBC to 0.1. The diatomic H2 vibrates much less, but the increased momentum pAB allows the fluorine atom to approach the diatomic with more energy eventually resulting in a reactive collision. This shows how what matters in reaction dynamics is not only the overall energy of the system, but also how it is distributed among the particles that are part of it. In fact, in the previous calculations many conditions that resulted in an overall bigger energy of the system generated unreactive trajectories, while this collision is reactive with a much reduced overall energy.
Polanyi's Empirical Rules
The Polanyi's empirical rules state that vibrational energy is more efficient in promoting a late-barrier reaction than translational energy and that at the same time the latter is more efficient in promoting an early-barrier reaction.[7]
We can think about the momentum of the colliding atom to be translational energy and the momentum of the diatomic to result in molecular vibrations. It follows that the trajectories for the forward reaction (early-transition state) illustrated in Figures 32-45 seem to agree with the prediction: in Figure 45, only a very small vibrational energy was necessary for the collision to be reactive because there was enough transitional energy (larger pAB), which is very efficient in promoting an early-barrier reaction. At the same time, in Figures 32-44 a much bigger vibrational energy was required in the reactants to proceed to the products because the translational energy supplied was lower. Therefore it is the translational energy that dominates the reactivity of an early-barrier reaction: in fact, small variations in it affect the reactivity much more than bigger variations in vibrational energy.
An analysis of the backward endothermic reaction (late-barrier) can further confirm this theory: vibrations will in fact be more efficient than translation in promoting this reaction. Figure 46 shows how a reaction with very low initial vibrational energy and relatively high initial transitional energy will not go on to react.
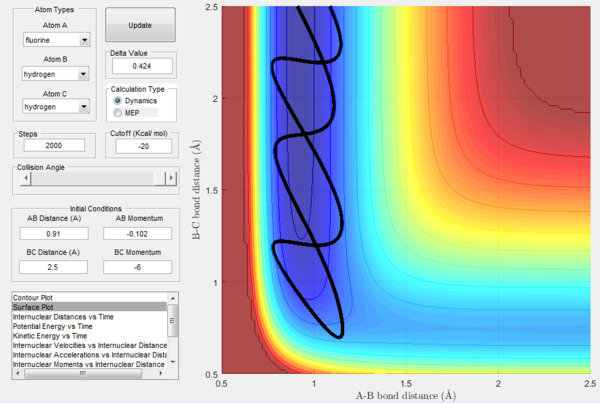
At the same time, Figure 47 illustrates a reactive trajectory of a system with high initial vibrational energy and low initial translational energy, confirming the rule's prediction. However, the initial momenta combinations that result in a reactive trajectory are not as simple as having an high vibrational energy and a low transitional energy, but are very few and hard to identify. More experimental data would be needed to further explore different combinations of initial momenta and confirm this rule. It is however safe to say that providing the system with energy higher than the activation energy is not enough to obtain reactive collisions, but relative initial momenta values are crucial in determining their reactivity.

References
[1] Imperial College London, Molecular Reaction Dynamics: Applications to Triatomic Systems (Lab Script May 2017).
[2] R. D. Levine, Molecular Reaction Dynamics, Cambridge University Press, UK, 1st edition, 2005, ch. 5, pp 148-175.
[3] P. Atkins and J. de Paula, Atkins' Physical Chemistry, Oxford University Press, UK, 10th edition, 2014, ch. 21, pp 879-936.
[4] G. B. Thomas and R. L. Finney, Calculus and Analytic Geometry, Addison-Wesley, USA, 8th edition,1992, pp. 881-891.
[5] H. Eyring, J. Chem. Phys., 1935, 361(2), 107–115.
[6] R. Masel, Principles of Adsorption and Reactions on Solid Surfaces, Wiley, New York, 1996.
[7] Z. Zhang, Y. Zhou and D. H. Zhang ,J. Phys. Chem. Lett., 2012, 3 (23), 3416–3419.
