MRD:felixdcifd915
Molecular Reaction Dynamics, Felix de Courcy-Ireland, 01062960
Exercise 1:
What value does the total gradient of the potential energy surface have at a minimum and at a transition structure?
At both values, the gradient has a value of zero.
Briefly explain how minima and transition structures can be distinguished using the curvature of the potential energy surface?
If a trajectory is started exactly on either a minima or a transition state, the trajectory will remain there forever. The two can be differentiated by selecting a point very near to either of the turning points and analysing the ensuing path of the trajectory.
If a point selected either side of a transition state, the trajectory will "roll down" the potential energy surface to another local minima, for example, the reactants or the products. If the point is selected very close to a minima, the trajectory will "flow" down the PES to the minima.
Minima and transition states can be discussed in terms of the derivative of the PES. A transition state is a saddle point in the PES, and is therefore a local minima in one dimension, and a local maxima in the other dimension. A minima, by definition, is minima in all dimensions.[1]
Nf710 (talk) 18:45, 2 June 2017 (BST) Yes this is correct. it is a maximum in the reaction coord and a minimum orthogonal to it. this is called taking the normal modes and is a linear combination of or he coordinates
Report your best estimate of the transition state position (rts) and explain your reasoning illustrating it with a “Internuclear Distances vs Time” screenshot for a relevant trajectory.
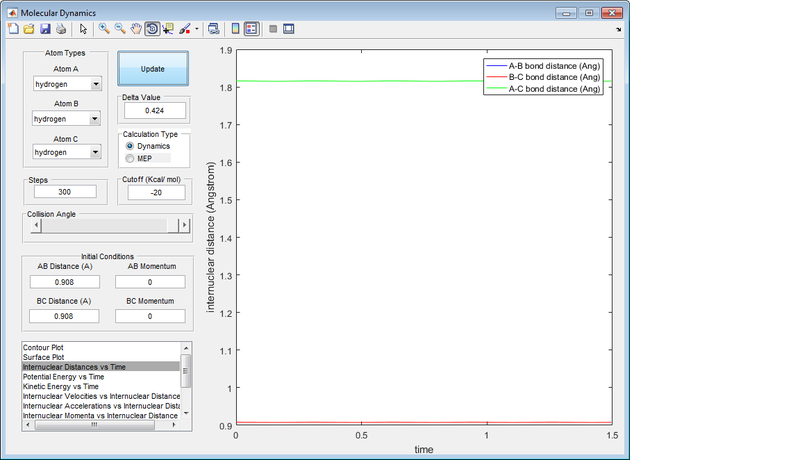
Best estimate of the transition state position is at r1 = r2 = 0.908 Å .
For the reaction of a hydrogen atom with dihydrogen, there is a symmetrical ridge running down the centre of the PES. If neither the molecule of hydrogen or the hydrogen atom have any initial momentum, and are the same distance apart, this leads to an unreactive trajectory, which remains on the ridge running through the PES.
The diagram below shows nicely the ridge that runs through the transition state where r1 = r2 .
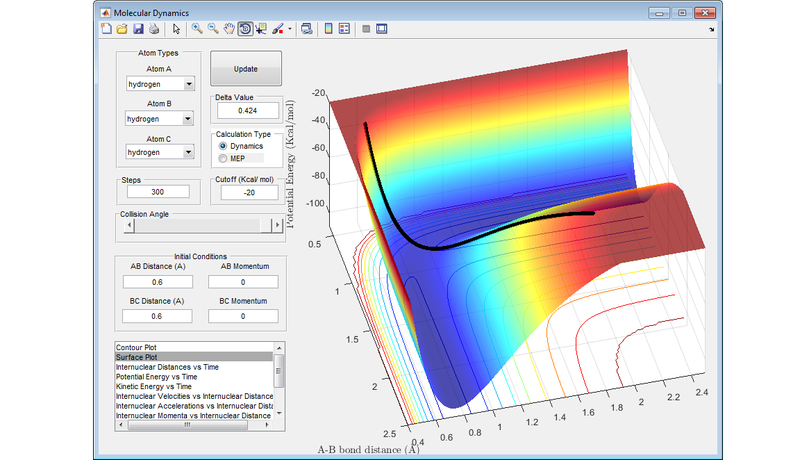
The transition state is the point of maximum energy along the minimum energy reaction path between reactants and products, and lies at the bottom of this ridge through the PES. In the idealised configuration of the transition state, there will no kinetic energy (either in the form of translational or vibrational energy) in the system, and this is represented by the value of 0 gradient on the PES. Any configuration close to the transition state will still have some kinetic energy in the system, and this is represented by these molecules being on a very slight slope of the PES.
With this description in mind, the plot of Internuclear Distance vs. Time (Diagram 2) is useful when trying to optimise the distances between the hydrogen atoms to locate the transition state, for at the point where the internuclear distances cease to fluctuate, there is effectively no kinetic energy in the system, and the transition state has been located.
Comment on how the MEP and the trajectory you just calculated differ
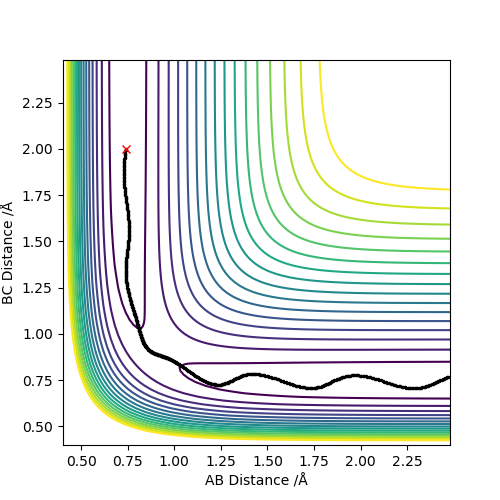
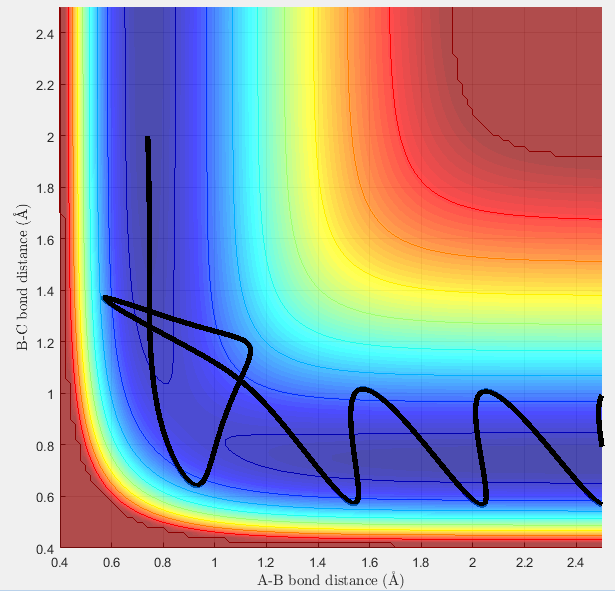
The Minimum Energy Path (MEP) calculation involves setting the velocity equal to zero at every step, resulting in the trajectory finding the bottom of the PES (Diagram 3). The trajectory will then remain on the bottom of the trajectory. With the dynamics calculation, even if the initial trajectory has no momentum, will gain momentum as it flows down the surface of the PES. This means that when the trajectory reaches the bottom of the PES, it will start to move up the other face of the PES. This leads to the undulating path that is seen in Diagram 4, and represents the vibrational energy in the hydrogen molecule.
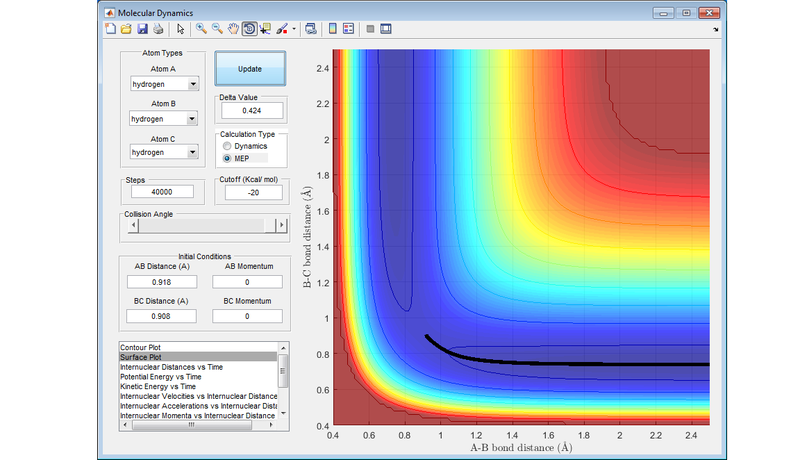

As can be seen in the diagram below, if the initial conditions selected are the conditions to which the system tended towards in the previous calculation (using both the MEP and dynamics calculation type), the hydrogen molecule will not react.

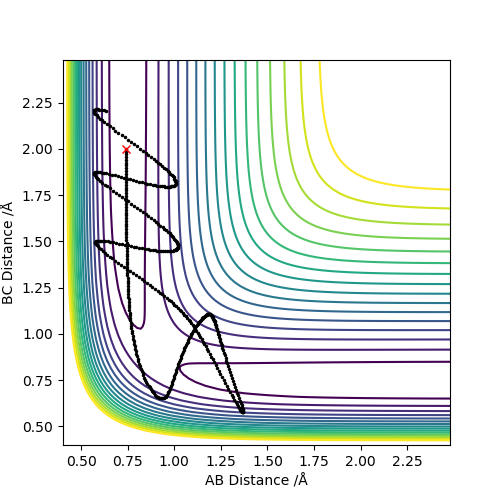
Complete the table by adding a column reporting if the trajectory is reactive or unreactive. For each set of initial conditions, provide a screenshot of the trajectory and a small description for what happens along the trajectory
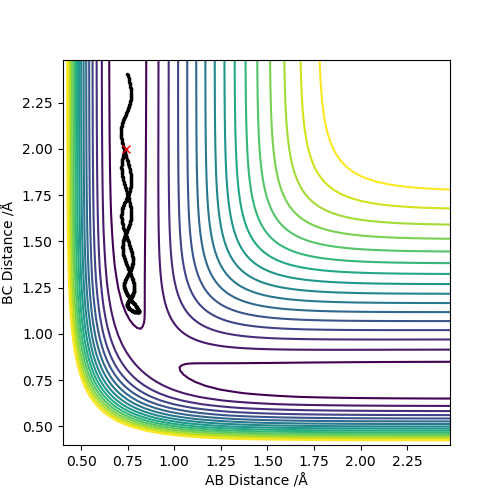
- For the initial positions r1 = 0.74 and r2 = 2.0, run trajectories with the following momenta combination:
| p1 | p2 | Reaction? | Diagram Number |
|---|---|---|---|
| -1.25 | -2.5 | Reaction | 6 |
| -1.5 | -2.0 | No reaction | 7 |
| -1.5 | -2.5 | Reaction | 8 |
| -2.5 | -5.0 | No reaction | 9 |
| -2.5 | -5.2 | Reaction | 10 |

State the main assumptions of Transition State Theory.
Transition State Theory can be discussed either in terms of thermodynamics or a more molecular/kinetic approach can be adopted.
In a discussion of kinetics, collision theory is adopted, whereby atoms and molecules are hard spheres, and collisions between atoms and molecules are assumed to be completely elastic - and these assumptions can be carried through to transition-state theory.[1]
In a more thermodynamic discussion of transition state theory, as reactant molecules come together to form product molecules, the reactant molecules will pass through a configuration, whereby any further atomic distortion will lead to the formation of product molecules. This configuration is termed the transition state. It is assumed in transition-state theory, that when molecules pass through this transition state, product formation is inevitable.[2]
Transition state theory selects a boundary surface between reactants and products and assumes that any group of molecules that cross this boundary surface become products, as the molecules will flow downhill to the products. This boundary surface is known as the critical dividing surface.[2]
Another assumption is that during the reaction, the Boltzmann distribution of energy is maintained for the reactant molecules.[2]
The final assumption, is that a configuration of molecules crossing the critical surface from the reactant side will have a Boltzmann distribution of energy corresponding to the temperature of the reacting system.[2]
Given the results you have obtained, how will Transition State Theory predictions for reaction rate values compare with experimental values?
Transition-State theory is a classical model, with no quantum mechanical considerations. Therefore, where the simulation in Diagram 9 accurately predicts that the original hydrogen molecule will be retained, and not react with the incoming hydrogen atom, transition-state theory would have predicted that a reaction does take place.
Transition state theory also states that the reactant molecules pass through the saddle point minimum of the PES, however this is not true, for the trajectory can pass from reactants to products without passing through the saddle point minima (see Diagram 10).[3]
Transition-state theory is therefore liable to predict that reaction occurs when in fact it does not, and would entirely base any predictions on rates of reaction upon the speed of the reactant molecules. It could therefore predict that a reaction happens incredibly fast, when in fact, the reaction does not happen at all. Transition-State theory would not all for barrier recrossing which can be seen in Diagram 9.
Nf710 (talk) 18:58, 2 June 2017 (BST) This is not down to QM it just has too much energy
Exercise 2:
PES Inspection
Classify the F + H2 and H + HF reactions according to their energetics (endothermic or exothermic)
How does this relate to the bond strength of the chemical species involved?
The reaction between F and H2 is exothermic. The reaction between H and Hf is endothermic.
Listed below are the bond dissocation enthalpies for dihydrogen and hydrogen fluoride.[1]
H-H = 436 kJ/mol H-F = 565 kJ/mol
In the reaction of a fluorine atom with a molecule of hydrogen, the bond formed between one of the hydrogen atoms and the fluorine atom is stronger than that of the dihydrogen bond, this compensates for the breaking of the dihydrogen bond, and leading to an overall exothermic reaction.
The reaction between a hydrogen atom and hydrogen fluoride to form dihydrogen, and lead to the ejection of a fluoride ion is endothermic, as the bond dissociation enthalpy of the bond being lost is greater than that of the bond being formed.
Locate the approximate position of the transition state
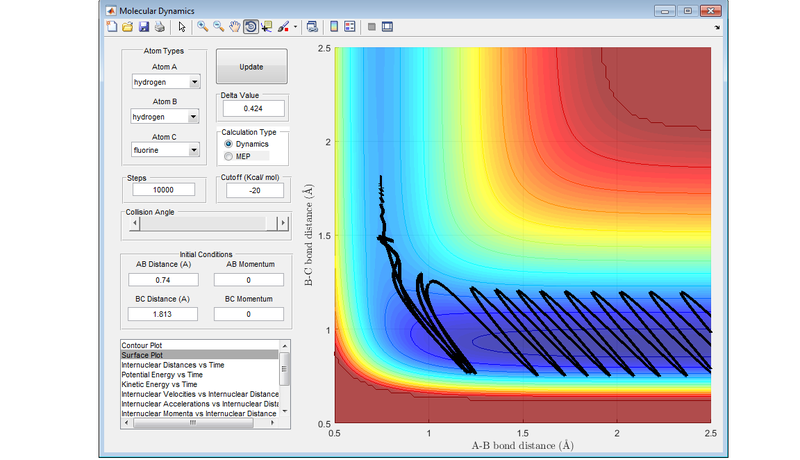
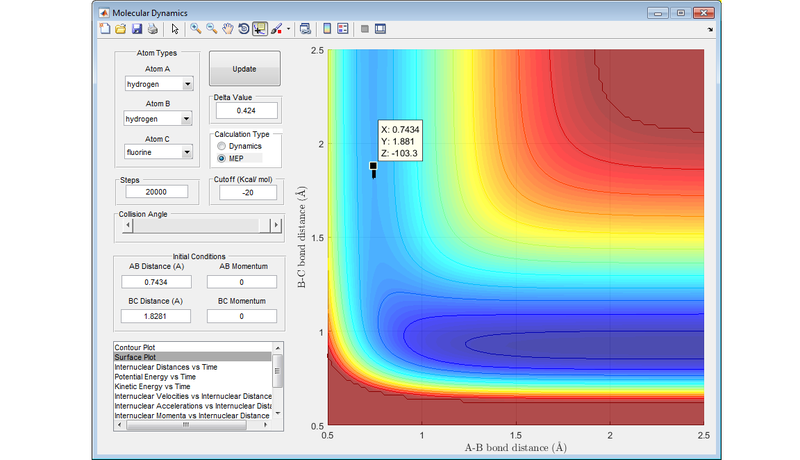
The transition state was located by setting the distance between the hydrogen molecules equal to the equilibrium bond distance for dihydrogen (0.74 Å) and neither the hydrogen molecule nor the incoming fluorine atom were given any initial momentum. The end point of consecutively closer trajectories (either reactants or products) were then used to narrow down the rough point of the PES of the transition state. If a value is taken above the 1.813 Å distance between the fluorine atom and the nearest hydrogen atom, the trajectory flows back to the reactants. If a value is chosen which is lower than the 1.813 Å, then the trajectory flows down to the products.
Report the activation energy for both reactions.
Activation Energy for F- to H2: 104.020 - 103.750 = 0.27 kcal/mol = 1.130 kJ/mol
Activation Energy for H- to HF: 134.025 - 103.750 = 30.275 kcal/mol = 126.67 kJ/mol
Finding the activation energy requires finding the value for the energy of the transition state in the previous question. Values were then taken either side of this point towards the reactants and product respectively, and an MEP analysis was carried out. From the top of the potential energy vs time graph, the value for the energy of the transition state was determined, and used in both calculations. This value is 103.750 kJ/mol.
At this stage, two MEP calculations have been carried out, with one trajectory headed towards the reactants and the other towards the products (Diagram ).
From the last coordinates of the two MEP analysis' that were carried out, a further dynamic calculation was carried out, and from the potential energy vs time plot, the energy of the reactants and products was determined (Diagram ).
The value obtained from the final dynamics calculation was then used as the energy of the reactant molecules and product molecules.
A value for the energy of the dihydrogen molecule and the fluorine atom was found to be 104.02 kJ/mol.
The value for the energy of the hydrogen fluoride molecule and hydrogen atom was found to be 134.025 kJ/mol.


Reaction Dynamics:
Discuss the mechanism of release of the reaction energy. How could this be confirmed experimentally?
As the trajectory flows down the PES, the newly formed hydrogen fluoride molecule is gaining kinetic energy in both the form of translational energy (the hydrogen atom also gains translational energy) and vibrational energy. An increase in the general kinetic energy of the system could be measured experimentally using calorimetry - calorimetry would confirm that the reaction has happened successfully, but would not be able to give information on vibrational energy. IR methods, such as Raman spectroscopy, would be able to give information on excited vibrational modes of the hydrogen fluoride molecule.
| pAB | Reaction? |
|---|---|
| 3.0 | Reaction |
| 2.5 | Reaction |
| 2.0 | No reaction |
| 1.5 | No reaction |
| 1.0 | No reaction |
| 0.5 | No reaction |
| 0 | No reaction |
| -0.5 | No reaction |
| -1.0 | No reaction |
| -1.5 | No reaction |
| -2.0 | No reaction |
| -2.5 | No reaction |
| -3.0 | Reaction |
Nf710 (talk) 19:01, 2 June 2017 (BST) Not really that helpful on its own. Needs the diagrams
Discuss how the distribution of energy between different modes (translation and vibration) affects the efficiency of the reaction, and how this is influenced by the position of the transition state.
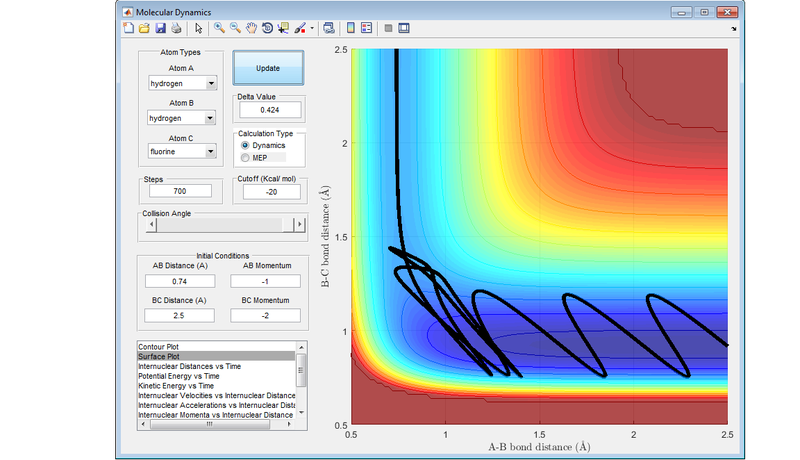
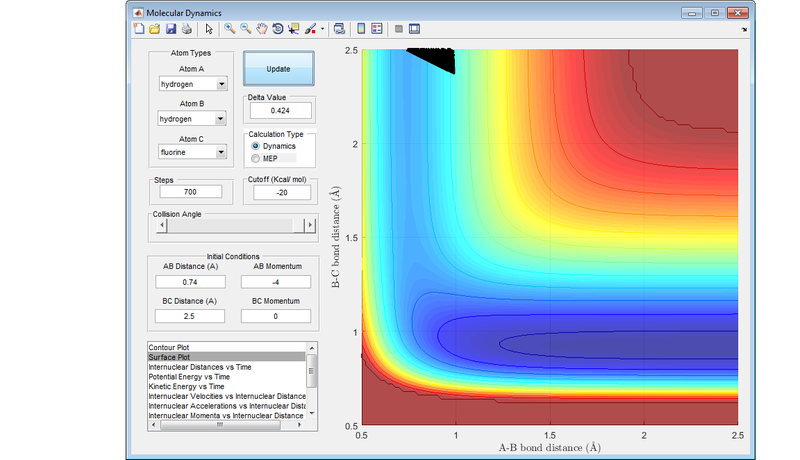
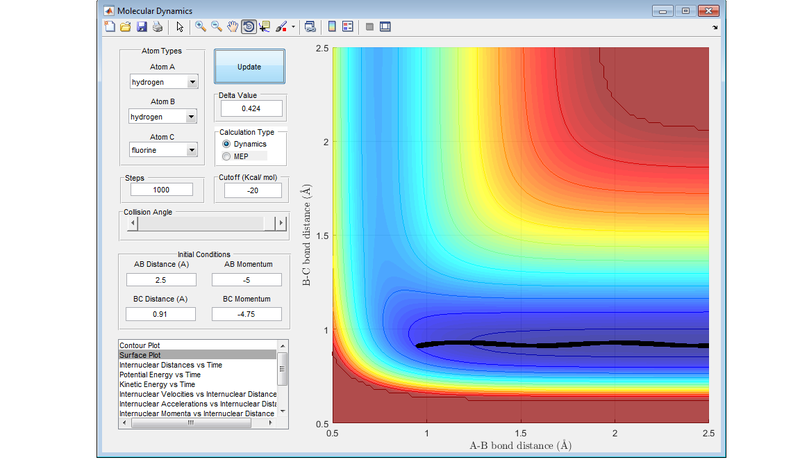
The balance between translational energy and vibrational energy (both contributing towards the total kinetic energy) can be used to predict whether given conditions will lead to a reactive trajectory, based upon whether the reaction contains an early or late transition state.
If a reaction has an early transition state (an attractive surface on the PES), such as the reaction between a fluorine atom and a hydrogen molecule, then translational energy is more likely to lead to a reactive trajectory.
If a reaction has a late transition state (a repulsive surface on the PES), such as the reaction between hydrogen fluoride and a hydrogen atom, the vibrational energy is more likely to result in a reactive trajectory.
These are an example of Polanyi's rules, with the following diagrams showing the four different combinations of either attractive surface or repulsive surface, and more vibrational energy or more translational energy. The results concur with Polanyi's rules.
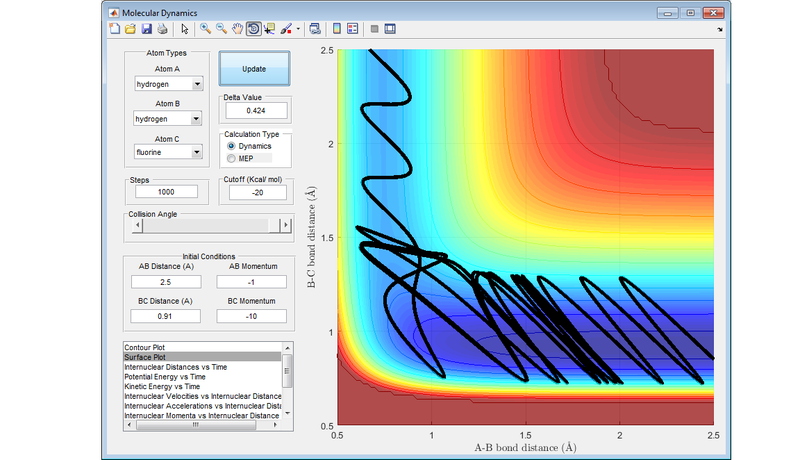
Nf710 (talk) 19:04, 2 June 2017 (BST) This last section is abit lacking. You should have explained the figures more and some of the trajectories look abit strange. Other than that this was a good report. everything answered fairly welll.
