MRD:ds5517
Exercise 1: H + H2 system
Dynamics from the transition state region
Question 1: On a potential energy surface diagram, how is the transition state mathematically defined? How can the transition state be identified, and how can it be distinguished from a local minimum of the potential energy surface?
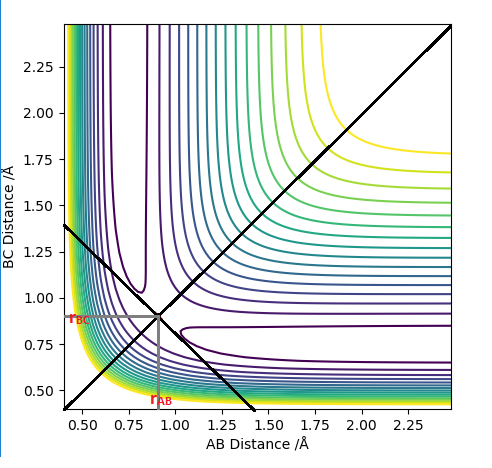
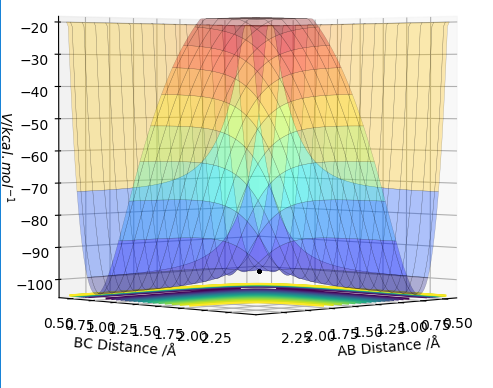
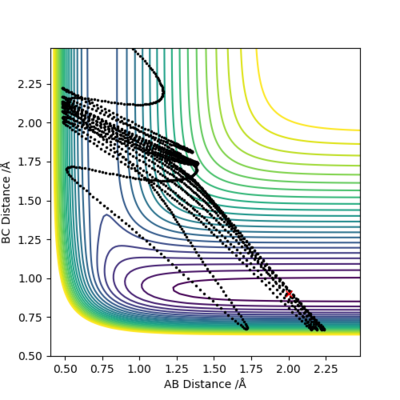
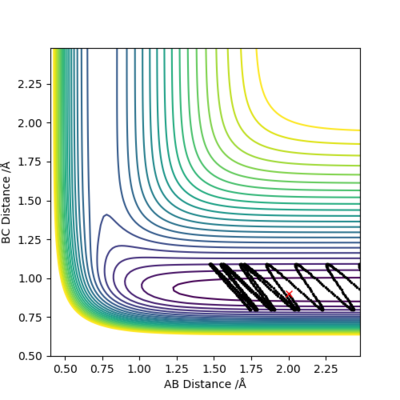
The transition state (TS) on a potential energy surface diagram is represented by the saddle point. It is a stationary point at which the gradient of the potential is zero. This means that the TS can be found by looking at the first derivative of the potentian energy surface: ∂V(ri)/∂ri=0. In order to distinguish the TS from a local minimum, we have to look at the second derivative as well. As mentioned above, the TS is a saddle point, which means that it has a symmetrical configuration at which rAB = rBC, shown on Figure 1. Since the TS is a saddle point, the second derivative of the reaction path potential will be negative (it is a maximum). However, the second derivative of the potential orthogonal to the reaction path potential at the TS will be positive (it is at minimum).[1]
Good but it’s a partial derivative. Also, you should be clearer, ie the AB and BC distance is only equal at the transition state when A, B, and C are the same species. It would be great if you referred to the graphs that you included. Sf3014 (talk) 22:03, 4 June 2019 (BST)
Trajectories from r1 = r2: locating the transition states
Question 2: Report your best estimate of the transition state position (rts) and explain your reasoning illustrating it with a “Internuclear Distances vs Time” plot for a relevant trajectory.
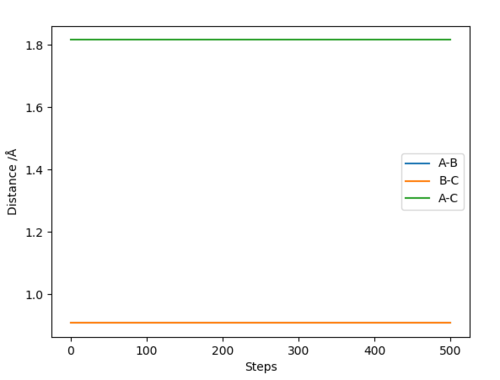
At the transition state (TS) the distances between A-B and B-C are equal. As mentioned above, the TS is stationary which results in the forces along AB and BC and the kinetic energy being zero. The value of the transition state position (rts) was found to be 0.907743 Å. This value can be rounded up to 0.908 Å, since using 7 decimal places is unneccessary.
The internuclear distances against time plot is horizontal. This confirms that the TS was found, since rBC=rAB (stationary) and the system vibrates symmetrically. Good but need to be clearer on how you found the position of your ransition state. Why are the AB and BC distances equal at the transition state?. Sf3014 (talk) 22:03, 4 June 2019 (BST)
Calculating the reaction path
Question 3: Comment on how the MEP and the trajectory you just calculated differ.
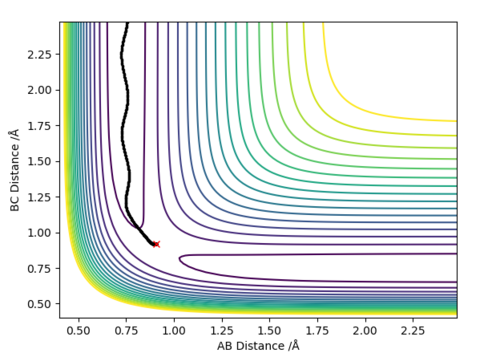
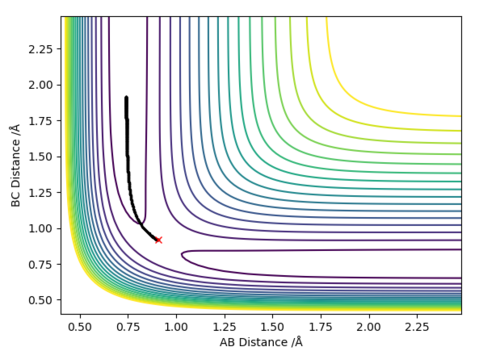
In the following section two different calculation types, Dynamic and Minimum Energy Path (MEP), are analyzed using the previously calculated value of rts=0.907743 Å. The system was slightly offset from the TS by setting rBC= rts + 0.01 = 0.917743 Å and zero initial momenta.
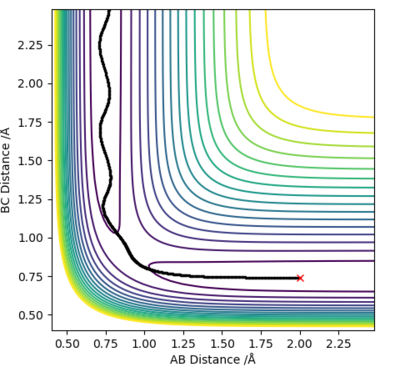
MEP is the lowest energy pathway from reactants to products. This method corresponds to infinitely slow motion where the mass of the atoms are not taken into account. Figures 5 and 7 show a relatively straight line for the reaction path. This indicates that the kinetic energy is zero and the atoms are not vibrating. Since the momenta/ velocities are set back to zero in each step, energy is not conserved from step to step which also results in a straight line. However, when we compare this with the Dynamic method shown on Figures 4 and 6, we can see a wavy line for reaction pathway. This indicates that the kinetic energy of the system is no longer zero, the atoms are oscillating. After considering both methods, it is safe to say that MEP is less realistic and useful. Good comparison but be careful on how you concluded you comparison, ie you final statement on the MEP calculation being less useful, in what sense?. Sf3014 (talk) 22:03, 4 June 2019 (BST)


Reactive and unreactive trajectories
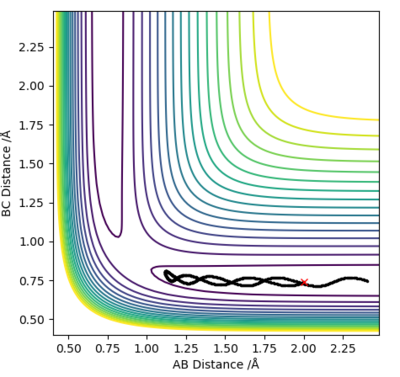
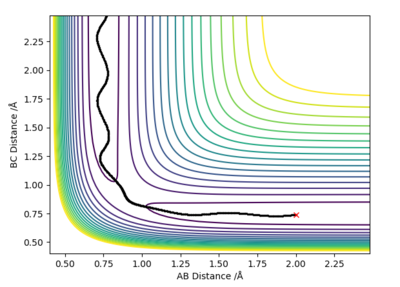
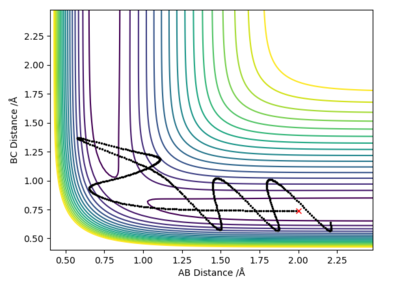
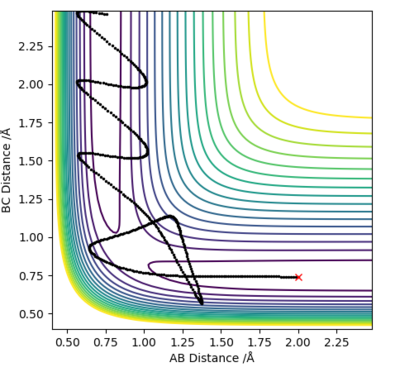
Question 4: Complete the table above by adding the total energy, whether the trajectory is reactive or unreactive, and provide a plot of the trajectory and a small description for what happens along the trajectory. What can you conclude from the table?
In conclusion, the success of a reaction does not depend only on the system having enough energy to overcome the activation energy barrier, but on other factors as well. As shown in the above table, the 4th example is higher in energy than the 1st or the 3rd, but is still unreactive. Good conclusion and observations. What are the other factors?. Sf3014 (talk) 22:03, 4 June 2019 (BST)
Transition State Theory [1]
Question 5: State what are the main assumptions of Transition State Theory. Given the results you have obtained, how will Transition State Theory predictions for reaction rate values compare with experimental values?
The aim of the transition-state theory (TST) is to study a reaction in which the reactants are in thermal equilibrium with the TS and to determine the rate constant of such reactions. This theory is based on the statistical properties of the system. The main assumptions of the transition-state theory are the following:
1. The reactants are in thermal equilibrium (quasi-equilibrium) with the TS species.
2. The electronic and nuclear motions are assumed to be separate from each other. This is equivalent to the Born-Oppenheimer Approximation in quantum mechanics.
3. The distribution of of reactants molecules and transition states among their states is directed by the Maxwell-Bolztmann laws.
4. Once the reactants have sufficient energy to cross the activation energy barrier at the TS, the products are formed in an irreversible reaction.
5. The reaction is treated classically.
The TST is not accurate in all cases. As shown in the table above, a system can have sufficient activation energy to reach the TS, but reform the products afterwards (example 4). This is in disagreement with assumption 4 of the TST. Small systems, such as the H-H-H, cannot only be treated classically, quantum mechanics must also be taken into account to obtain correct results. This disagrees with assumption 5. Good but how does the rate of the reaction compare between transition state theory (TST) and your examples? Also, where did you get your information on TST? Reference, please. Sf3014 (talk) 22:03, 4 June 2019 (BST)
Exercise 2: F - H - H system
PES inspection
Question 6: By inspecting the potential energy surfaces, classify the F + H2 and H + HF reactions according to their energetics (endothermic or exothermic). How does this relate to the bond strength of the chemical species involved?
F + H2 → HF + H

The reaction F + H2 → HF + H is is examined in the following section. As shown on Figure 8., the reactants are higher in energy than the products, therefore the reaction is classified to be exothermic. The bond being broken is the H-H single bond (432 kJ/mol) and an H-F single bond is formed (565 kJ/mol). Since F is more electronegative than H, the new bond is more covalent and stronger, due to which the overall reaction is exothermic.
H + HF → F + H2
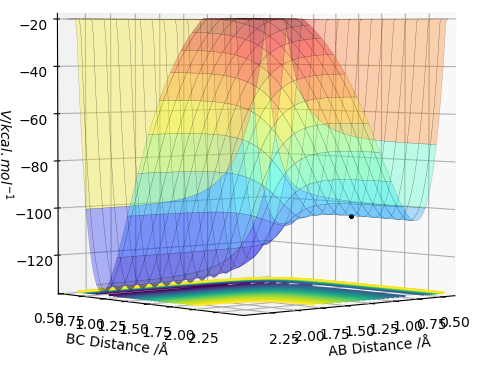
As discussed above, the H-F single bond is stronger than the H-H single bond. The reaction H + HF → F + H2 is therefore results in a breakage of a stronger bond in order to form a weaker. Thus the reaction is endothermic. As shown on Figure 9., the products are higher in energy than the reactants. Good but you need to be more clear, ie define A, B and C in your description of the potential energy surface. And where did you get the HF and H2 bond energies from? Reference, please. Sf3014 (talk) 22:03, 4 June 2019 (BST)
Position of Transition State
Question 7: Locate the approximate position of the transition state.
According to Hammond's Postulate, The structure of the transition state will resemble either the structure of the reactants or the products, depending which is closer in energy. The lifetime of the TS is essentially zero, thus this postulate is useful in determining the structure at the energy maxima (TS). Hammond suggested that in an exothermic reaction the TS will resemble the reactants (early TS) whereas in an endothermic reaction reaction it resembles the products.
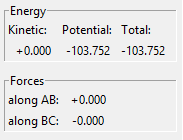
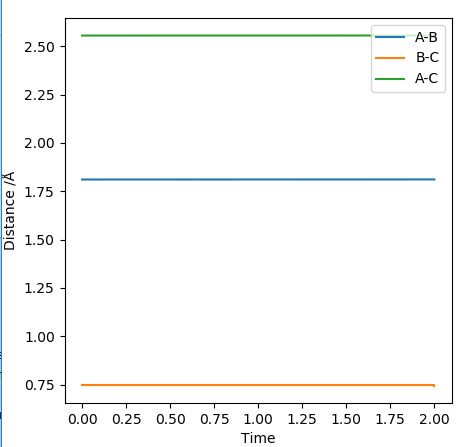
As the reaction F + H2 → HF + H is found to be exothermic, the TS will resemble the structure of H2. The bond length of H-H = 0.74 Å was used to determine the TS distances. Further decimal places were added to both the H-H and the H-F length until the forces along AB and BC equaled 0. The distances were found to be the following: H-F = 1.810790 Å and H-H = 0.744878 Å. Since the TS is stationary, the Internuclear Distance vs Time plot shows horizontal lines (there is no change in the distance between atoms). Very good description on locating the position of the transition state. Would be better if you referenced Hammond’s postulate and referred to figures. Sf3014 (talk) 22:03, 4 June 2019 (BST)
Activation Energies
Question 8: Report the activation energy for both reactions.
Activation energies:
The activation energies of both reactions were calculated by the difference in energy between the reactants and the transition state. Energy of reactants was found by slightly offsetting on of the r values, using the MEP calculation and the Energy vs Time graphs. The values can be found in the table below.
| Reaction | E of reactants (kcal/mol) | E of TS (kcal/mol) | Activation Energy (kcal/mol) | Illustration of the trajectory |
|---|---|---|---|---|
| F + H2 → H + HF | -103.959 | -103.752 | 0.207 | 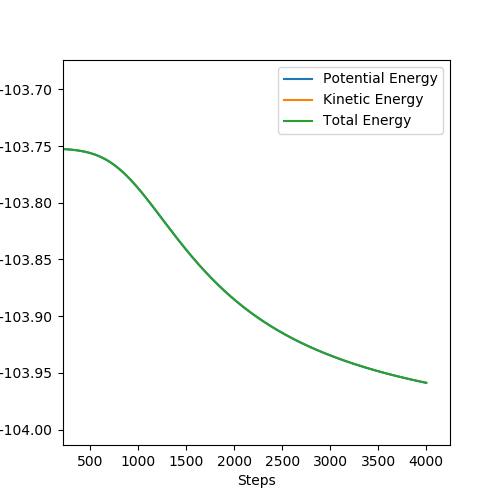
|
| H + HF → F + H2 | -133.794 | -103.752 | 30.042 | 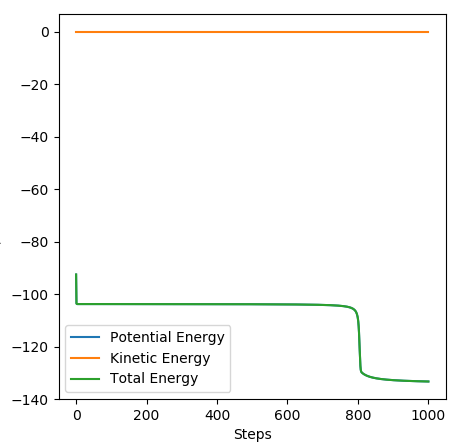
|
Good explanation. Sf3014 (talk) 22:03, 4 June 2019 (BST)
Reaction dynamics
Polanyi's Empirical Rules[1]
Hammond's postulate states that an exothermic reaction will proceed with an early TS, which will resemble the the reactants. In contrast, in an endothermic reaction the TS will resemble the products in a late TS. Polanyi's Empirical Rules relate to Hammond's Postulate. Polanyi studied different potential energy surface trajectorys of A + BC → AB + C type reactions (like F + H2 → H + HF, as discussed above) in order to determine the dyanamics and energy changes of such reactions. Polanyi found that a reaction with an early TS (eg. F + H2 → H + HF) will favour high translational energy of the reactants which will result in high vibrational energy of the products. In contrast, a reaction with late TS (eg. H + HF → F + H2), will favour high vibrational energy of the reactants and will end up having high product translational energy.
Release of Energy
F + H2 → H + HF
Question 9: In light of the fact that energy is conserved, discuss the mechanism of release of the reaction energy. Explain how this could be confirmed experimentally.
As discussed above, F + H2 → H + HF is exothermic, the products are lower in energy than the reactants, thus energy is released from to system to the surroundings in the form of heat. The fact that energy is conserved can be confirmed and monitored by bomb calorimetry. Okay, but how will bomb calorimetry show this? Also, how does the momenta vs time graph show the conservation of energy? This is not clear in your explanation. Sf3014 (talk) 22:03, 4 June 2019 (BST)
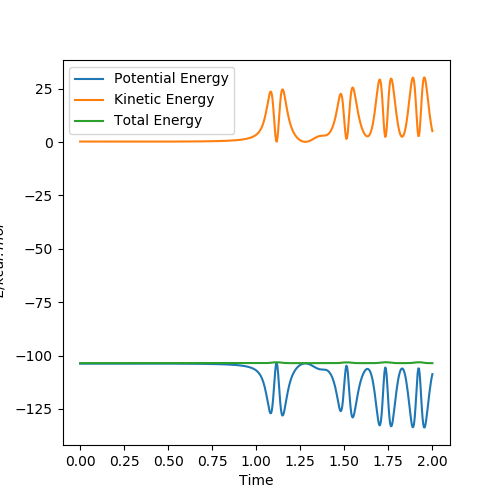
Figure 12 shows the energy against time plot for a successful collision. We know that the total energy of the system is constant (energy is conserved). Therefore, we see a horizontal line for the total energy. Figure 13 shows the momentum against time plot. The kinetic energy is the sum of vibrational and translational energies. A system with an early TS such as this one will favour low vibrational and high translational energies of the reactants (Polanyi's Rules) This is shown on Fig 13.

| rFH | rHH | pFH | pHH | Reactive? | Illustration of the trajectory | Comments |
|---|---|---|---|---|---|---|
| 2.0 | 0.74 | -0.5 | -3 | No |  |
Because the reaction has an early TS , it will favour low vibrational energy of the products to form the products (Polanyi's Rules). Since the system has high vibrational energy at the beginning, it crosses the TS, but then goes back and the H-H bond reforms. |
| 2.0 | 0.74 | -0.5 | -2 | Yes | 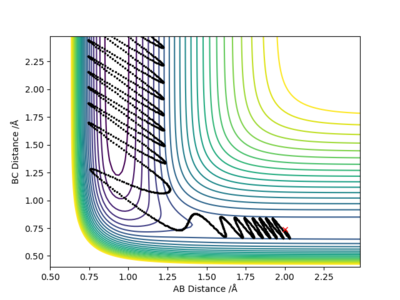 |
As we lowered the vibrational energy of the reactants, the reaction became successful. These conditions illustrate Polanyi's Rules, as the products in an exothermic reaction with an early TS have high vibrational energy. |
| 2.0 | 0.74 | -0.8 | 0.1 | Yes | 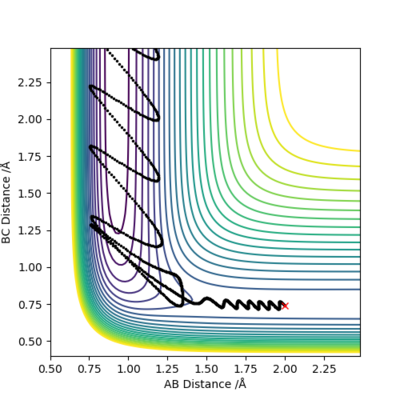 |
We now increased the vibrational energy of the products, which is favoured for an early TS reaction, thus products (H + HF) are formed. Just like in the first case, the system crosses the activation energy barrier, then reform the reactans. However, in this case it crosses the TS once again and the products are formed.Sorry, this is confusing, you switch between talking about the vibrational energy of the products and the reactants. Your initial values define the states of your reactants so stick to that in your descriptions. Sf3014 (talk) 22:03, 4 June 2019 (BST) |
H + HF → F + H2
Question 10: Discuss how the distribution of energy between different modes (translation and vibration) affect the efficiency of the reaction, and how this is influenced by the position of the transition state.
Polanyi's Rules describe the relationship between the success of a reaction, its TS (early/late) and how the translational/vibrational energies effect the system. These rules are described above.
Overall, this was a little confusing Polanyi's rules were place too far from descriptions. Sf3014 (talk) 22:03, 4 June 2019 (BST)

