MRD:dlk188
Exercise 1
Transition state (TS)
The transition state is defined as the saddle point on the potential energy surface, where the gradient of the potential is 0. The hessian eigenvalues can help distinguish the transition state from the local minimum on the potential energy surface Explain this with a formula.Pu12 (talk) 00:28, 27 June 2020 (BST) . Both positive and negative eigenvalues indicate the transition state has been found. Locating the transition state for this system :
The TS is estimated at 9.77 This should be 90.77.Pu12 (talk) 00:28, 27 June 2020 (BST)
pm , 0 momentum for the H-H-H system. This is confirmed as the force is reported to be approximately 0.00 and the hessian eigenvalues are -0.027 and +0.167.
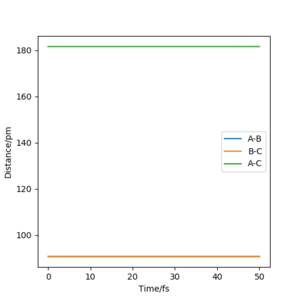
This particular system has a symmetric TS, it is neither endothermic or exothermic. As a result of this, the internuclear distances should be equal and should remain stationary at the transition state. The plot of the Internuclear Distances vs Time” below demonstrates the symmetry of the transition state in a simple way; equal distances between A-B and B-C. A-C is double A-B.
MEP
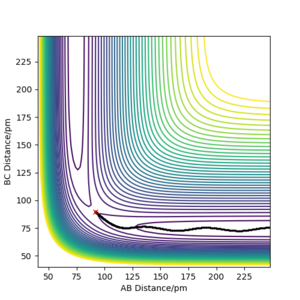
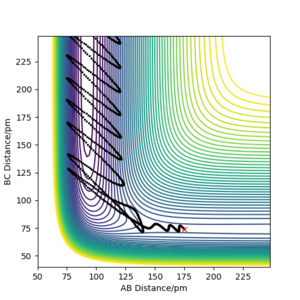
The reaction trajectory can be calculated by displacing the system from the transition state. This was calculated using two methods, shown below. The second having used the mep settings instead of the dynamic.
There are two main differences here, the trajectory length and the lack of oscillation in the mep calculation.
The mep always resets the gradient to 0 at each step, hence there is no oscillation. The mep is shorter as a result because once it falls into the low energy well, the gradient is 0 and the trajectory stops.
Unreactive and Reactive Trajectories
| p1/ g.mol-1.pm.fs-1 |
|
Etot | Reactive? |
|
Illustration of the trajectory | ||
|---|---|---|---|---|---|---|---|
| -2.56 | -5.1 | -414.28 | Yes | Reaction trajectory follows the standard trajectory expected, the internuclear distances plot demonstrates formation of the products. | 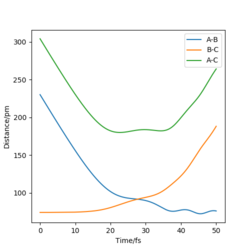
| ||
| -3.1 | -4.1 | -420.10 | No | Looking at the internuclear distance vs. time plot you can see that there is no change in the B-C distance, so the original H2 molecule is still intact, not enough energy to cross the barrier. | 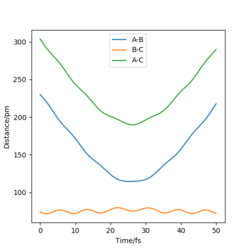
| ||
| -3.1 | -5.1 | -413.98 | Yes | The internuclear distance vs. time plot shows the correct change in the both the A-B and and B-C distances.What about changes in vibrations?Pu12 (talk) 00:28, 27 June 2020 (BST) | 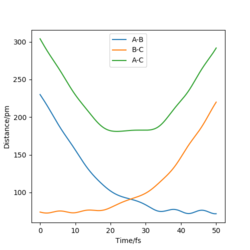
| ||
| -5.1 | -10.1 | -353.48 | No | recrosses the transition state barrier; i.e initially could be seen as reactive as the reactants do react to form products, but then the reverse reaction occurs and the trajectory is taken back to reactants. This is also shown clearly in internuclear distances vs. time plot- the A-B and B-C distances end up where they originally started. | 
| ||
| -5.1 | -10.6 | -349.48 | Yes | The plots shows that initially it seemed as though the reaction was recrossing the barrier like the previous example, however the added kinetic energy was enough to reach the transition point, as the final A-B and B-C distances are correct. A contour plot has been added in the next column to better demonstrate this. | 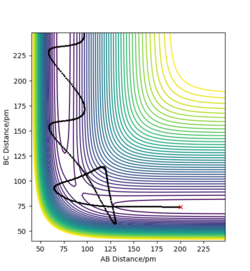 File:5.1 dlk18.png File:5.1 dlk18.png
|
The results in the table demonstrate that a slight increase in momentum/kinetic energy, whilst keeping all other initial conditions the same can help the reaction trajectory reach the TS when it otherwise could not What about system recrossing?Pu12 (talk) 00:28, 27 June 2020 (BST) .
TST Theory
The transition state theory predicts that there is no re-crossing of the barrier, once the transition state is reached the reactants will follow the reaction trajectory to form the product(s) of the reaction. The results shown in the table above however demonstrate that barrier re-crossing is possible. The implications of this on the reaction rate values is that the value predicted by the Transition state theory would be higher than experimental values and hence an overestimate.
Exercise 2
PES Inspection
The F-H-H system was set up with the H2 molecule approaching the Fluorine atom. The potential energy surface shows that the F + H2 reaction is exothermic, and the HF + H reaction is endothermicGraphical evidence?Pu12 (talk) 00:28, 27 June 2020 (BST) . This indicates that the HF bond is of higher strength than the HH bond.
Finding the Transition State:
The Transition state was estimated the same way as the previous system, though this time the transition state is asymmetric. Using Hammond's postulate and the fact that the reaction is exothermic, the (early) transition state was estimated to be X. This is confirmed by the force values X AND X and the eigenvector (omega squared values): X,X. The change in sign indicating the presence of a saddle point. So, what is the TS position?.Pu12 (talk) 00:28, 27 June 2020 (BST)
The activation energy:
The activation energy for each reaction was found in different ways.
For the HF + H reaction, an MEP calculation was performed to displace the reaction from the transition state towards the reactants. This was done using 4000 steps. The plot below demonstrates the energy displacement from the transition state and shows the energy drop into the well of pure reactant state: The activation energy was found to be 124kj/mol approximately.
For the H2 + F reaction, the activation energy was found using Hammond's Postulate; kowing the reaction is exothermic, the expected activation energy would be small. This was found by displacing the distance of the HF atom 4000pm away, ensuring the energy would be that of pure reactant only in this case.
The activation energy was found to be 1 kj/mol approximately.
Reaction Dynamics
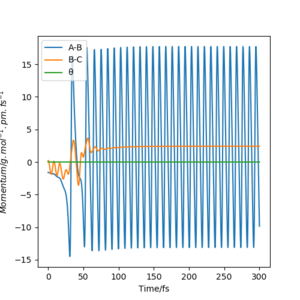
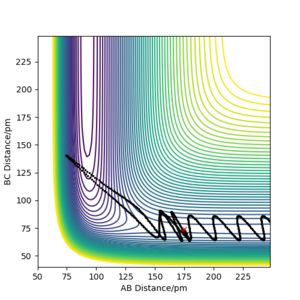
The reaction trajectory for H2 + F is plotted below:
The reaction trajectory shows oscillation in the product region of this reaction. This is shown more clearly in the momentum vs. time plot.
Exothermic reactions like this can be classified as having attractive or repulsive potential energy surfaces. The oscillation implies that there is vibrational energy within the product. By varying the momentum of r(HH) we are able to determine the type of energy surface. The plot below demonstrates this:
By varying r(HH) momentum and looking at this plot, there is clear indication of the reaction mechanism being governed by the release in energy from the repulsion between the HH atoms. The mechanism of this reaction goes via the repulsion between the H-H atoms initially. It is the energy released due to the repulsion pushes the H atom towards the F atom (which is heavier) and in turn produces vibrational energy in the HF product. The implications of this mean that there is vibrational energy in the product as well as translational energy, implying a mixed energy release. The key thing to note here is that the presence of vibrational energy enables this to be tested using IR spectroscopy experimentally, due to the vibrational excitation. When studying potential energy surfaces, Infrared chemiluminescence (IRCL) is a common method. This method relies on the emission of infrared photons from the excited state; therefore, the proposed mechanism for the energy release in this reaction could be confirmed using this method.
It is clear that the distribution of energy between translational and vibrational affect the efficiency on the reaction, depending on whether or not it is endo or exothermic. Vibrational energy is better at facilitating endothermic reactions, and translational better for exothermic reactions.Reference?Pu12 (talk) 00:28, 27 June 2020 (BST)

