MRD:dkb17
H + H2 System
Treating H and H2 as an A, BC system, if H approached molecule H2 with sufficient momenta, the molecules will have sufficient energy to overcome the activation energy to form an AB, C system.
Defining and distinguishing transition state
From a energy surface plot, the transition state can be found at r where: ∂V(r1)/∂r1 x ∂V(r2)/∂r2=0. The transition state point can then be determined by analysis of second order derivatives. The transition point can be found where: the second partial derivative of q1: ∂2V(q1)/∂q12 is >0 and the second partial derivative of q2: ∂2V(q2)/∂q22 <0. The transition state is the saddle point at which the minima of q1 intersects the maxima of q2.
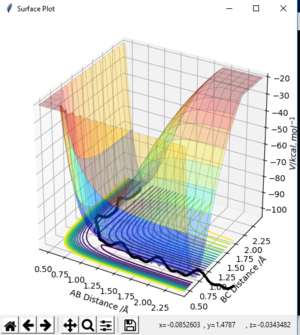
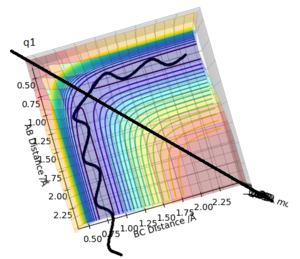

From a contour plot, the transition state can be found at the point at which the A-B bond length is equal to the B-C bond length, the point at which both the AB bond is forming and the BC bond is dissociating.
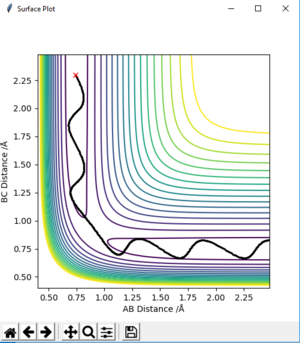
Correct answer overall but the plot of q2 is very unclear and it would be much easier to show it from above like for q1. How would you distinguish the TS point from a local minima? Pu12 (talk) 12:46, 4 June 2019 (BST)
Transition state position
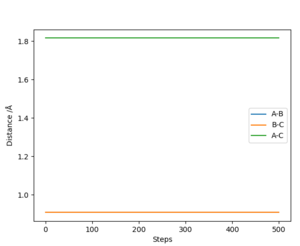
The transition state position can be determined by setting the momenta of AB and BC to 0, and testing different values for both AB and BC distances until there is no observed oscillation on the internuclear Distances vs Time plot. This distance was found to be 0.907743 Å. As momenta has been set to 0 in this calculation, the molecule will only oscillate at the defined maxima, and as it has no, momenta, is unable to roll of the maxima meaning the molecule remains only at the maximum point.
Comparison between mep and trajectory
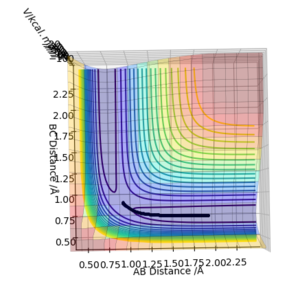
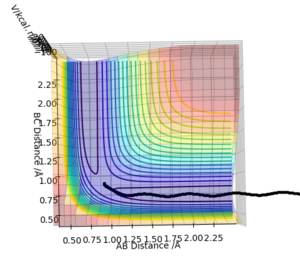
The MEP plot shows a smooth line with no oscillations whilst the dynamics plot shows a long, wavy line. This is because in the mep calculation, molecules are assumed to be moving infinitely slowly. However, this is not an accurate model as the momenta/velocities are always reset to zero. In a real scenario, as modelled in the dynamics calculation, atoms have a mass, and momenta. This means that in the dynamics calculation, the H2 oscillations is accounted for.
Reactive and unreactive trajectories
| p1 | p2 | Etot | Reactive? | Illustration | Description |
|---|---|---|---|---|---|
| -1.25 | -2.5 | -99.018 | Yes | 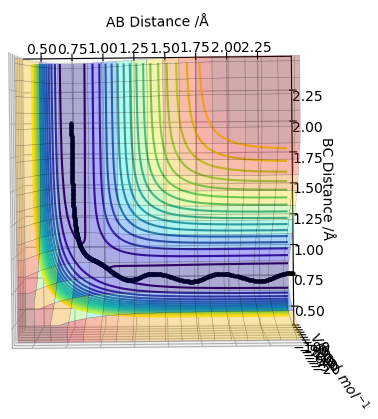 |
This a reactive pathway. Reactants require enough energy to overcome the transition state energy barrier to access the products. |
| -1.5 | -2.0 | -100.456 | No | 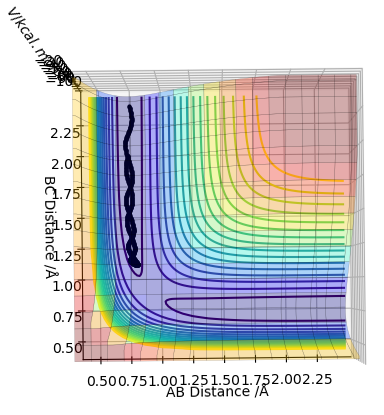 |
This an unreactive pathway. Reactants in this situation don't have enough energy to overcome the transition state energy barrier to access the products. |
| -1.5 | -2.5 | -98.956 | Yes | 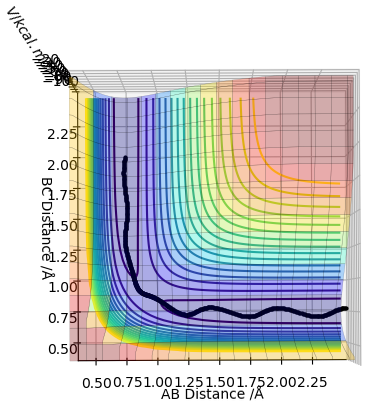 |
This is a reactive pathway. The reactants have the sufficient energy required to overcome the transition state energy barrier enabling access to the products. |
| -2.5 | -5.0 | -84.956 | No | 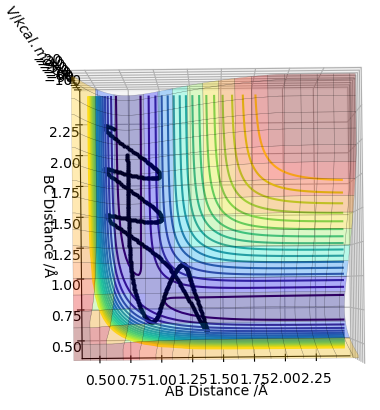 |
This is an unreactive pathway, even though the reactants have enough energy to access the transition state, excess vibrational energy prevents a reaction from occurring, resulting in the molecules sinking down the potential well back to the reactants. |
| -2.5 | -5.2 | -83.416 | Yes | 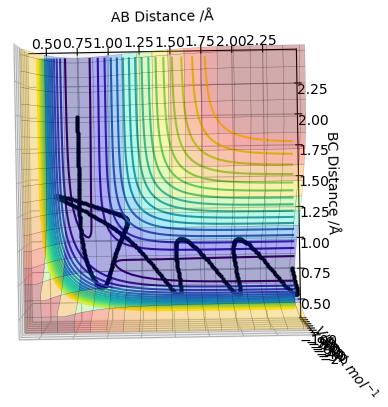 |
This is a reactive pathway. The reactants have enough energy to access the transition state and thus, the products Should mention recrossing of the transition state, this is different than the first example. Pu12 (talk) 12:46, 4 June 2019 (BST)
. |
You should talk about vibrations for each example and at the end you should also say what you can conclude from the table. Pu12 (talk) 12:46, 4 June 2019 (BST)
Transition state theory
The main assumptions of transition state theory are that [2]:
1. Reactants are in equilibrium with he transition state 2. The transition state does not collapse back to the reactants after the transition state has been formed Any reaction that reaches the transition state goes on to make products.Pu12 (talk) 12:46, 4 June 2019 (BST)
3. The energy of particles in the system will be governed by the Boltzmann distribution
Transition state theory would predict a higher rate of reaction than the experimental. This is because the transition state theory assumption, the transition state can't go back to the reactants which means that all molecules who achieved transition state structure will proceed to the reaction. Good. Pu12 (talk) 12:46, 4 June 2019 (BST)
F - H - H system
PES inspection
F+ H2
By inspection of the potential energy surfaces, the reaction between H2 and Fluorine is an exothermic reaction whilst the reverse is endothermic But why? Pu12 (talk) 12:46, 4 June 2019 (BST) . This indicates that the H-F bond is stronger than the H-H bond. With the following conditions:
AB distance: 0.74 Å BC distance: 2.3 Å AB momentum: 0 kgm/s BC momentum: -11.5 kgm/s
The following conditions result in the following reaction:
H2 + F → HF + H
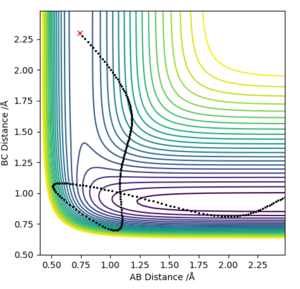
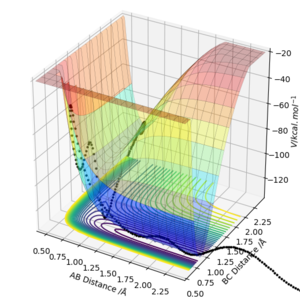
You can't see if the reactions are endothermic or exothermic from these graphs as you can't see the potential energy of the reactants or products. Pu12 (talk) 12:46, 4 June 2019 (BST)
Transition state analysis
The transition state can be found by setting the momentum of AB and BC to 0 and testing different distances for AB and BC until the forces along Ab and BC are 0. This was found where AB= 0.744873 Å and BC= 1.81106 Å.
Activation energy
The activation energy can be determined, by doing performing a dynamics calculation with AB distance displaced from transition state conditions Performing an MEP calculation. Pu12 (talk) 12:46, 4 June 2019 (BST) . The calculation was then changed from 500 to 5000 steps. The activation energy was then found by finding the difference in energy between the total and potential energy lines ? Your answers are correct, but I don't understand your reasoning as surely the difference between total and potential energy lines would just be kinetic energy? Your graphs don't make this more clear also as you can't see potential energy on the second graph and it looks like it just overlaps the total energy, how do you get an energy difference of 31.82 from this?? Pu12 (talk) 12:46, 4 June 2019 (BST) . This gave the following energy
Energy= 0.267 KJ/mol Energy is in kcal. Pu12 (talk) 12:46, 4 June 2019 (BST)

The same calculation was performed for the HF + H system under an mep calculation giving an energy= 31.82KJ/mol

Reaction Dynamics
The following conditions provide a reactive trajectory for H2 and F:
AB Distance: 0.74 BC Distance: 2.3 AB Momentum: -1.9 BC Momentum: -2.2
Through analysis of the energy vs time graph, the mechanism of release of reaction energy can be determined. The energy/time graph shows energy exchange between potential and kinetic energy. As potential and kinetic energies are mirror images of each other, this graph is a manifestation of the conservation of energy as a maxima in potential energy is opposite a minima in kinetic energy. As the reaction proceeds translational energy is converted into vibrational energy and H-H vibrational energy is transferred to H-F vibrational energy, resulting in energy exchange with surrounding molecules in the system This can be determined experimentally using calorimetry as the reaction is exothermic. Good. Pu12 (talk) 12:46, 4 June 2019 (BST)

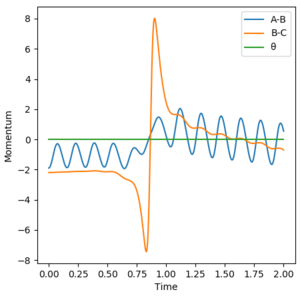
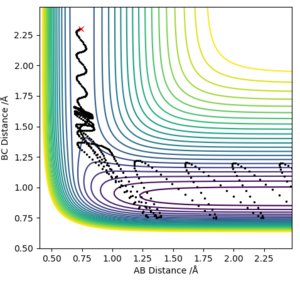
Momenta
Polanyi's rules state that vibrational energy is more likely to promote a reaction with a late transition state compared to transnational energy [1]. A dynamics calculation was run for a H2 and F system. The following conditions were used:
AB distance: 0.74 Å, BC distance: 2.3 Å, BC momentum: -0.5 kgm/s. AB momentum was varied from -3 to 3 kgm/s.
A significant amount of energy is put into the H-H system. The key observation in this system is that as momenta decreases to 0, the reaction pathway changes from a reactive pathway to an unreactive pathway. This is due to a lack of tranlsational energy which prevents the reactants from accessing the transition state.
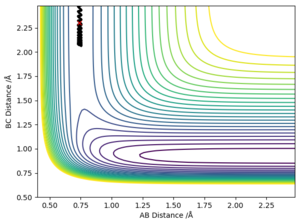

Polanyi's Rules
In a reaction with an early transition state, translational energy is more important than vibrational energy according to Polanyi's rules. HH momenta in the calculation corresponds to HH translational energy. Given that the H2 + F reaction is exothermic, the reaction will proceed with an early transition state and the transition state will thus resemble the reactants. Therefore, the reaction will be initiated with translational rather than vibrational energy. However, in a HF + H reaction, as the reaction is endothermic, the transition state will come late and resemble the products. This means that the reaction is more likely to be initiated by vibrational energy rather than translational energy, according to Polanyi's rules. Good. Pu12 (talk) 12:46, 4 June 2019 (BST)
Decent report but some parts of questions have been missed or questions have unclear answers, mainly due to imperfect illustrations. Pu12 (talk) 12:49, 4 June 2019 (BST)
References
1. J. Phys. Chem. Lett.20123233416-3419 Publication Date:November 6, 2012 https://doi.org/10.1021/jz301649w
2. https://en.wikibooks.org/wiki/Statistical_Thermodynamics_and_Rate_Theories/Eyring_Transition_State_Theory (Accsessed 24/05/19)
