MRD:dk2016
Daniel Kirrane - dk2016 - Molecular Reaction Dynamics Computational Lab
Exercise 1: H-H-H
1. On a potential energy surface diagram, how is the transition state mathematically defined? How can the transition state be identified, and how can it be distinguished from a local minimum of the potential energy surface?
The gradient of the potential energy with respect to atomic distance is 0 at both minima and maxima on a potential energy surface. A maximum represent a Transition state. A small disturbance from a maxima will cause the system to fall down to a lower energy. The transition state can be found by finding a saddle point on the surface, this exists where one second derivative is greater than zero and the other is less than zero.
| ∂V(ri)/∂ri | ∂2V(ri)/∂ri2 | |
|---|---|---|
| r1 | 0 | >0 |
| r2 | 0 | <0 |
Good discussion of a saddle point. However, please go back and read carefully over the notes in the Script. R1 and R2 are not the dimensions in which you are looking for the maximum and minimum. You need to define two new lines q1 and q2 and take the partial differential of V - the potential energy, relative to these. You will see when you look at the surface plot that q1 is a line that passes through the origin and obeys R1 is equal to R2, V has a minimum along this line. q2 is at 90 degrees to q1 and follows the reaction coordinate AB + C to A + BC, V has a maximum along this line. Mak214 (talk) 10:58, 23 May 2019 (BST)
2. Report your best estimate of the transition state position (rts) and explain your reasoning illustrating it with a “Internuclear Distances vs Time” plot for a relevant trajectory.
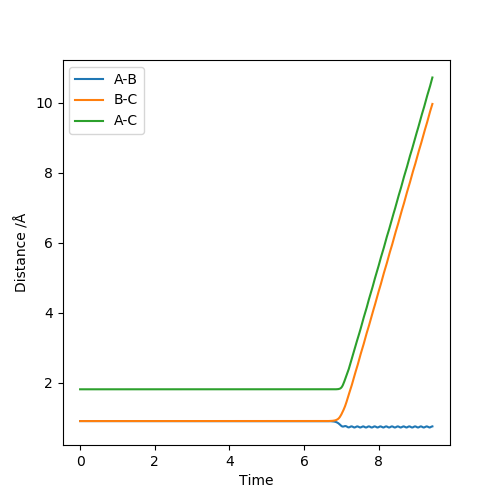
Using the dynamics calculation, the best estimate for the transition state found was to be r1 = r2 = 0.907778Å .The figure below shows that there is no change in the atomic distance with time, for a t = 7 until it shoots off forming AB. This shows that the current transition state position estimate is sufficiently accurate but further optimisation would be required for the exact r1 and r2 values to be found.
Good. Mak214 (talk) 11:00, 23 May 2019 (BST)
3. Comment on how the mep - The reaction path, minimum energy path or mep - and the trajectory you just calculated differ.
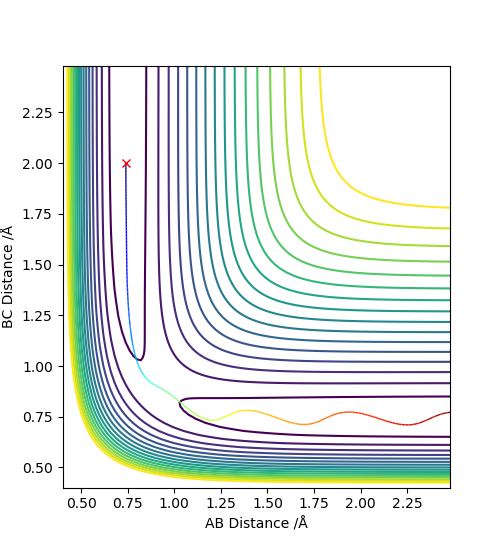
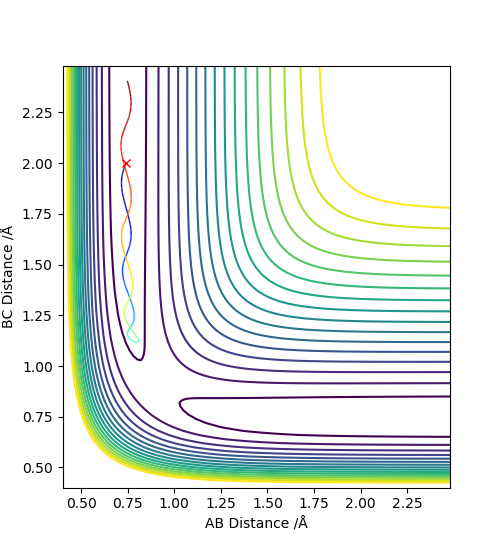
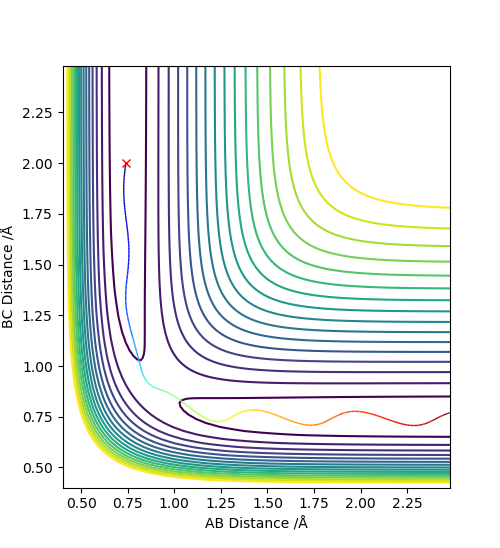
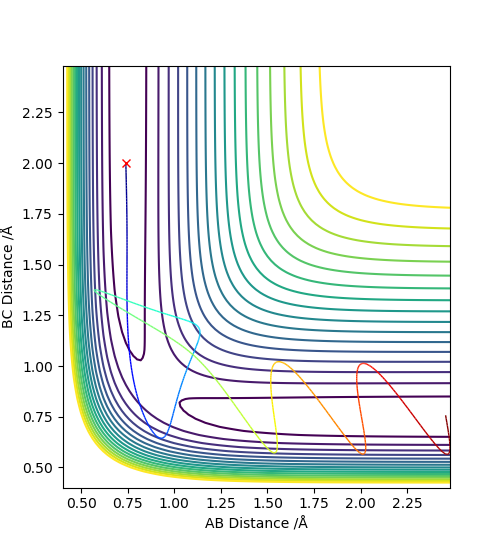
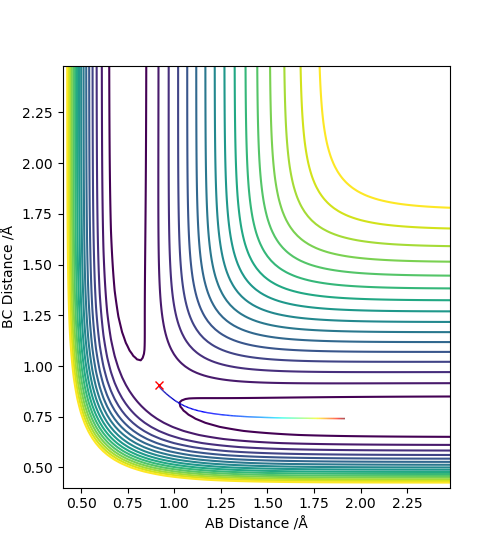
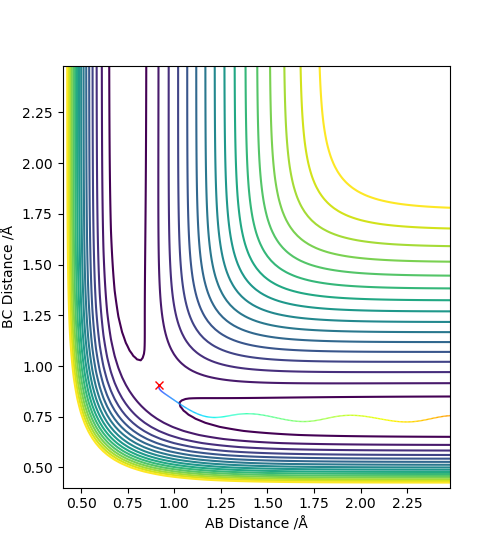
The MEP, minimum energy path is able to indicate the preference of path the system follow. However, it is unable to provide information on the vibrational energy. This means that in MEP the system will follow the the minima of the surface but in ta dynamics calculation, there will be an vibration about the BC bond formed in this case. Therefore the dynamics calculation provides a better representation of the actual situation. In the MEP, velocity is made to be zero at each infinitesimal path along the minima of the surface. Yet, in the dynamics calculation, there are oscillations of the bond due to the accumulation of momenta. The figures below show the contour plots for both methods of calculation - MEP and Dynamics: Good. Mak214 (talk) 11:02, 23 May 2019 (BST)
| Method | MEP | Dynamics |
|---|---|---|
|
|
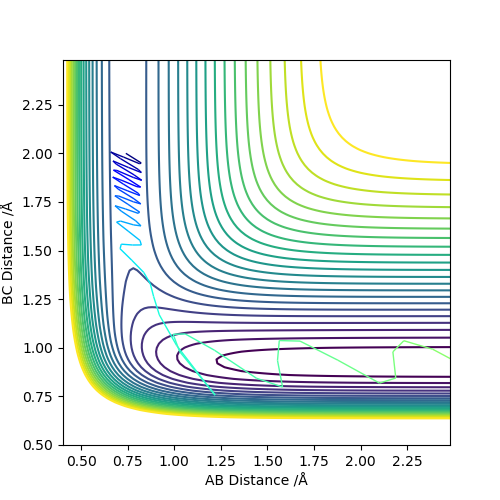
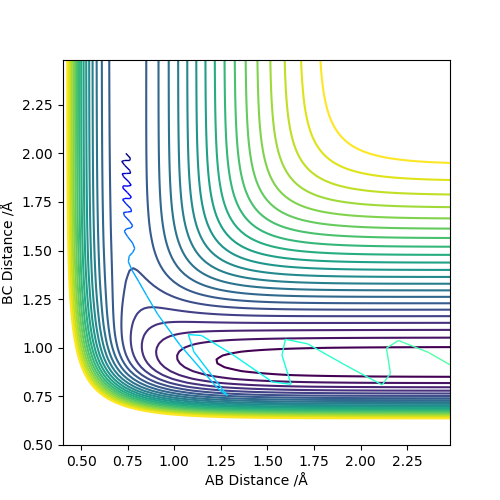
4. Complete the table above by adding the total energy, whether the trajectory is reactive or unreactive, and provide a plot of the trajectory and a small description for what happens along the trajectory. What can you conclude from the table?
OK. Can you make a general conclusion now looking at these 5 different trajectories and their starting conditions? Mak214 (talk) 11:04, 23 May 2019 (BST)
5. State what are the main assumptions of Transition State Theory. Given the results you have obtained, how will Transition State Theory predictions for reaction rate values compare with experimental values?
In Transition State theory there are the following assumptions:
- Molecular systems that have passed the transition state, going towards the products, wont return back to cross the transition state again and reform the reactants.
- The system goes through the lowest energy transition state on the potential energy surface.
- Classical mechanics applies to the transition state.
From the models seen above, the first assumption doesn't apply because there is sufficient energy to overcome the energy barrier and cross back to the reactants. It is seen that having crossed the transition state once, the system can easily return over the transition state and reform the reactants again. So, if the energy barrier is sufficiently high to prevent this return over the transition state, transition state theory is a good model. However, in cases where the energy barrier is particularly small, quantum tunnelling is also in play. In this case, the probability of a particle being found beyond the barrier is greater than zero, it is not forbidden. This is despite not having enough energy to overcome the barrier.
Where is your Reference!!!! :( Good discussion Mak214 (talk) 11:04, 23 May 2019 (BST)
Exercise 2: H-F-H
1. By inspecting the potential energy surfaces, classify the F + H2 and H + HF reactions according to their energetics (endothermic or exothermic). How does this relate to the bond strength of the chemical species involved?
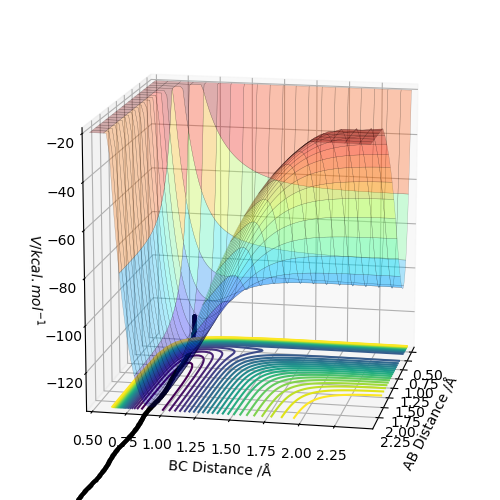
In this figure, BC is the HF distance.
The Figure above shows the Dynamics Surface Plot for a H-H-F system. Using this potential surface it can be seen that the formation of the H-H bond is an endothermic reaction. The potential surface indicates that the reactants are higher energy than the products when the direction of reaction goes: F + H2 -> HF + H This suggest an exothermic reaction. Therefore in the opposite direction, an endothermic reaction is expected. This is evidence for the H-H bond being weaker than the H-F bond. This is proven to be true by the respective bond enthalpies for H-H and H-F: 436 kJmol-1 and 565 kJmol-1. Where did you get this data from? You really should be using referencing.. Mak214 (talk) 16:03, 23 May 2019 (BST)
Good. Mak214 (talk) 16:03, 23 May 2019 (BST)
2. Locate the approximate position of the transition state.
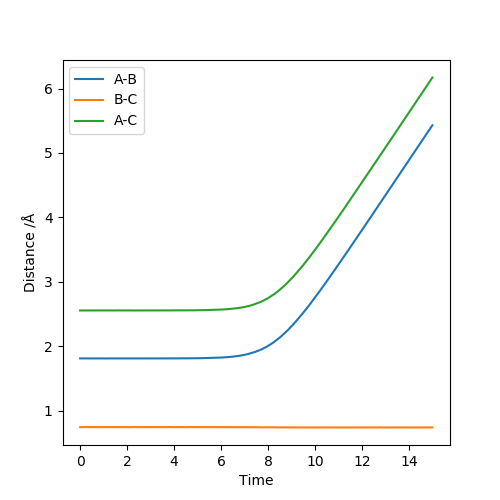
The transition state was approximated using Hammond's postulate, following the trajectory for the exothermic reaction in which HF is formed, the transition will resemble the the reactants. This means the H-F distance will be much larger at the Transition state than in the products. Using the Dynamics calculation, the transition state was optimised as r1 = 1.8113 r2 = 0.7438, p1 = p2 = 0, energy = -99.119 kJmol-1 . These values were found using a method of trial and error to find a structure with no oscillations for the longest period of time possible.
The figure above shows that there is no change in atomic distance with time until t ≈ 7. After this time, a deviation causes the formation of H-H. This is the opposite to what is expected due to the H-F bond being stronger and thus going down the potential slope of the formation of HF should be energetically more favoured.
Good. Mak214 (talk) 16:03, 23 May 2019 (BST)
3. Report the activation energy for both reactions.
The activation energy Ea can be calculated using the following equation: Ea = ETS - Ereactant. The energies were obtained by slightly displacing the equilibrium of the Transition state so the initial and final energies can be obtained and from which the activation energies can be calculated.
The energy of the Transition state was found to be -99.119 kJmol-1 in the previous question.
Activation energy of HH + F reaction:
-99.119 - (-104.02) = 4.901 kJmol-1
Activation energy of HF + H reaction:
-99.119 - (-133.90) = 34.781 kJmol-1
Good. Mak214 (talk) 16:03, 23 May 2019 (BST)
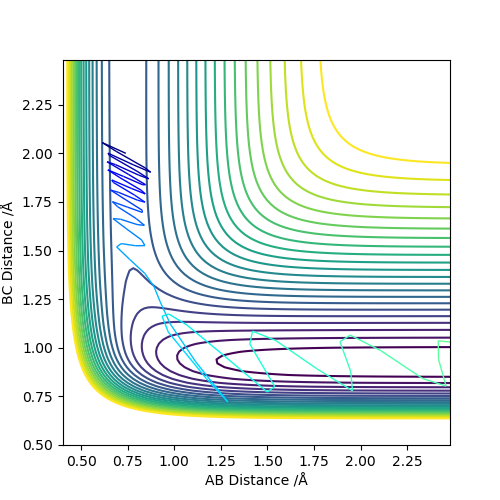
4. In light of the fact that energy is conserved, discuss the mechanism of release of the reaction energy. Explain how this could be confirmed experimentally.
The following values correspond to the first two cases below:
rHF = 2.00
rHH = 0.74
pFH = -0.5
-3 < pHH < 3
For the third case, a different set of values were used:
rHF = 2.00
rHH = 0.74
pFH = -0.8
pHH = 0.1
Good. Mak214 (talk) 16:03, 23 May 2019 (BST)
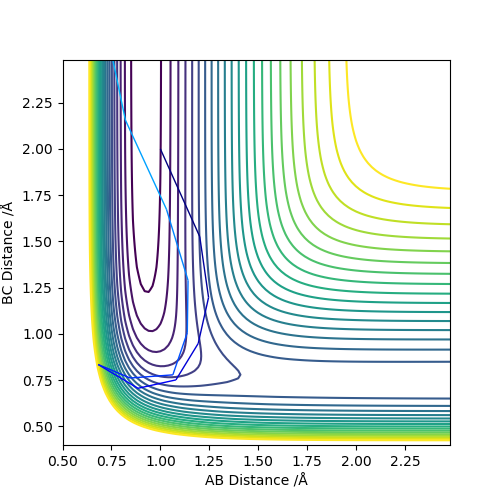
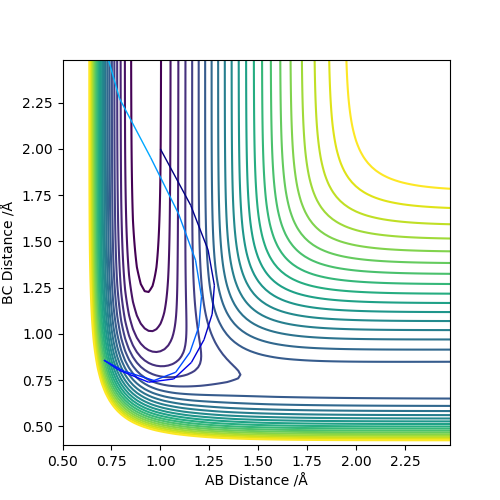
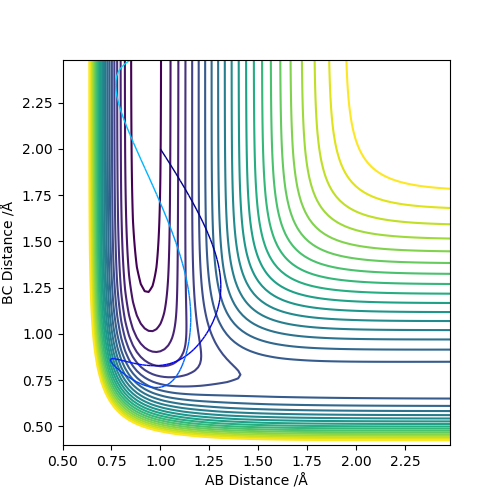
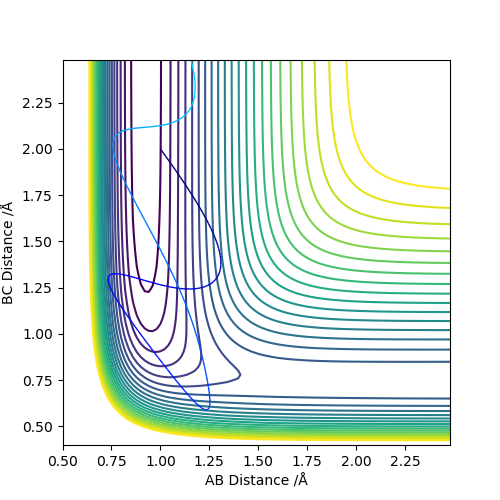
5. Discuss how the distribution of energy between different modes (translation and vibration) affect the efficiency of the reaction, and how this is influenced by the position?
rHH = 2.00
rHF = 1.00
| pHF | pHH | Reactive? | Internuclear Distance vs Time Plot | Contour Plot |
|---|---|---|---|---|
| 0 | -9 | Reactive Trajectory | 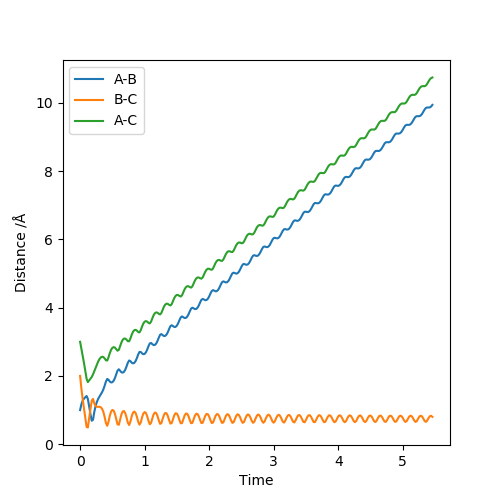
|
|
| 1.5 | -7.5 | Reactive Trajectory | 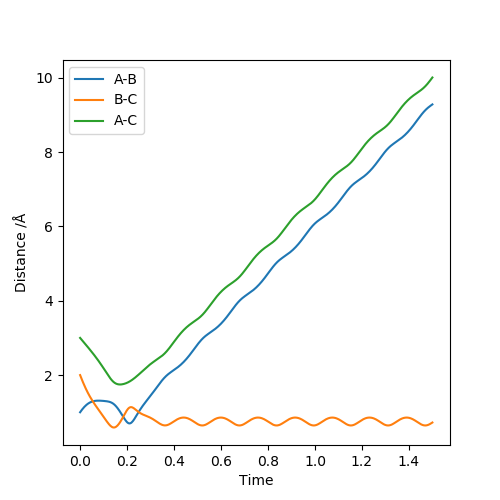
|
|
| 3 | -6 | Non-Reactive Trajectory | 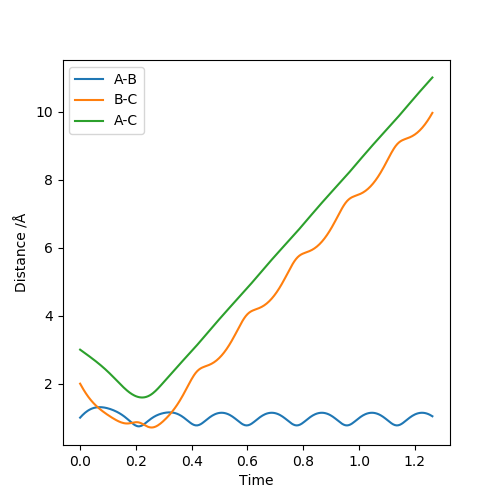
|
|
| 4.5 | -4.5 | Non-Reactive Trajectory | 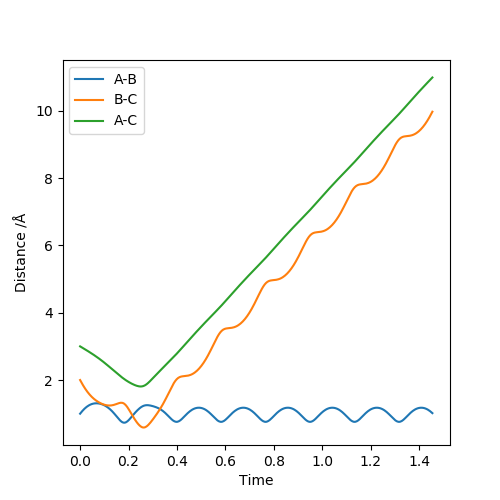
|
|
Where is your discussion? Mak214 (talk) 16:03, 23 May 2019 (BST)

