MRD:dianaberheci
EXERCISE 1: H + H2 system
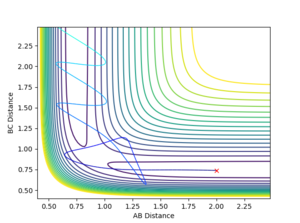
Transition states and minima points

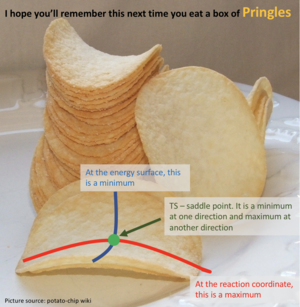
I don't feel like you've described the saddle point well. You've talked about how to use second derivative to differentiate a maximum and a minimum. But it is not how to differentiate a minima and a TS(saddle point). --Sw2711 (talk) 11:43, 11 May 2018 (BST)
Locating the transition state
Calculating the reaction path
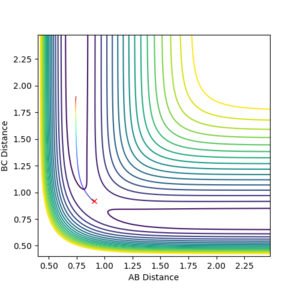
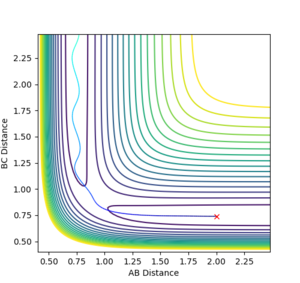
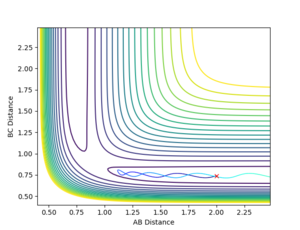
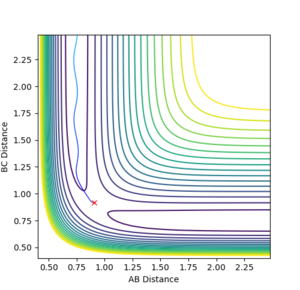
When setting the GUI as follows (r1=rts+0.01=0.9175, r2= rts=0.9075, zero momenta), the obtained trajectories differ according to the calculation method employed, Dynamics or MEP. While the Dynamics calculation (Figure 2) accounts for both the minimum reaction pathway and the atomic oscillations associated with the reaction, thus it is a model close to reality, MEP (Figure 3) does not account for the oscillations, as it starts each step with zero momentum, making it a less powerful and revealing calculation. It is not ‘less powerful’. For MEP we are looking for the gradient of the surface at a point. For example, this is the trajectory where you place a ball at some point on the energy surface without kicking it. Which way would this ball roll. --Sw2711 (talk) 11:44, 11 May 2018 (BST)
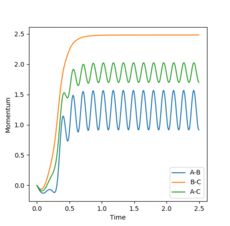
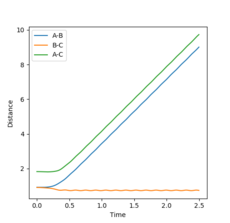
Analysis of the Internuclear distance vs time and of the Internuclear momenta vs time plots yields the final values of r1, r2 and average p1, p2, all at large t (Figures 4 and 5):
r1(2.5)=9.00, r2(2.5)=0.77
p1(2.5)=2.50, p2(2.5)=1.25
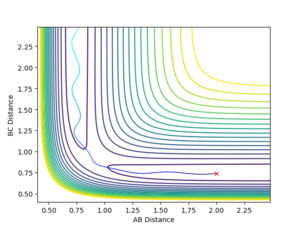
Changing the initial conditions to r1=rts=0.9075, r2= rts+0.01=0.9175 gives the opposite momenta results and opposite internuclear distances (Figures 6 and 7):
r1(2.5)=0.77, r2(2.5)=9.00
p1(2.5)=1.25, p2(2.5)=2.50
Therefore, changing the initial conditions leads to the program calculating the reaction pathway for the reverse process (A-B reacting with C instead of A reacting with B-C).
 |
 |
 |
 |
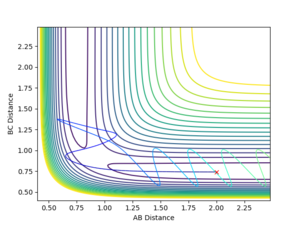
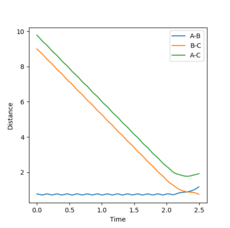
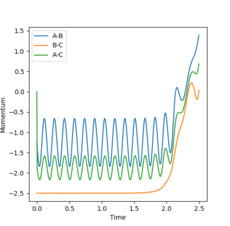
Changing the initial conditions in the GUI to the values observed at the final positions of the trajectories calculated above (momenta taken with reversed signs) will lead to the plots in Figures 8 and 9. This shows that after the first hydrogen atom (A) collided successfully with the initial hydrogen molecule (B-C) to form a new A-B + C system, the particles still have enough energy to oscillate. Therefore, after a while, the A-B molecule will collide again with the C particle (B-C bond shortening in Figure 8), leading to the initial A + B-C system reforming.
 |
 |
Reactive and unreactive trajectories
Holding the initial positions r1=0.74, r2=2.00 constant, the momenta values were changed in order to see if they yield more or less reactive reaction pathways. You have predicted all reactive and unreactive trajectories correctly. Here are a few more comments Case 1&5: interesting that initial H2 is stationary (same as case 5). You need to double check the animation. Sometimes, if you give a big momentum to the molecule, it makes you feel like they are static. But they are NOT! Case 2-3: Good Case 4: clearly there is enough energy to overcome the activation energy (compared to case 2). The phrase you need is ‘recrossing the TS). Sometimes, even if you have very big energy, it won’t form the product (This will be covered in your third year course). You need a combination of vibrational and translational energy to form the product. Simply adding one type of energy won’t work sometimes. --Sw2711 (talk) 11:48, 11 May 2018 (BST)
Assumptions of Transition State Theory
Transition State Theory explains the molecular reaction dynamics by assuming a quasi-equilibrium is established between the reactants and the transition state[2]. However, for this theory to work, certain assumptions must be made. First of all, the Born-Oppenheimer approximation is taken into account, as the nuclei are considered to be much heavier than electrons, therefore electrons can be negligible, and the particles are assumed to obey classical mechanics. Thus, TST assumes that unless the particles have enough energy, the transition state cannot be attained; this ignores the concepts of tunneling or barrier re-crossing, which may lead to lower theoretical reaction rates than the experimentally obtained results for reactions with low activation energies, where tunneling probability is high. Further, the theory assumes that all energies of the reactant atoms are following the Boltzmann distribution, which is only true when systems have enough time to reach a thermal equilibrium. Subsequently, the TST assumes that every reaction will pass through the lowest energy saddle point (the transition state), an assumption which can fail at high temperatures because particles may already populate high energy states in this situation. In this case, the TST reaction rates are higher than the experimental ones.[2]
EXERCISE 2: F-H-H and H-H-F systems
F+H2 and H+HF reactions
F+H2 is an exothermic reaction, whilst H+HF is endothermic.
I need evidence to see this using the program--Sw2711 (talk) 11:49, 11 May 2018 (BST) The H-H bond enthalpy is 104 kcal/mol [3] and the H-F bond enthalpy is 136 kcal/mol [3]>; therefore, the HF molecule requires more energy in order for the H-F bond to be broken than the H2 molecule. Knowing these values, one can estimate the reaction enthalpies for the 2 aforementioned processes:
The calculations confirm the theoretical aspects too; fluorine is a much more electronegative atom than hydrogen, therefore an H-F bond will be much stronger than an H-H bond due to the partial ionic character of the H-F bond.
Hammond's Postulate states that the transition state will resemble the reactants if the process is exothermic and the products if the process is endothermic.[4] Therefore, the F + H2 transition state will be more similar to the reactants, and the H+HF transition state will resemble the products (i.e. H2+F).
In order to find the transition state coordinates for the 2 systems, multiple initial conditions have been analysed to see which ones would have zero kinetic energy and would show no oscillations on the contour plot, as these are the criteria for finding the transition state.
For H+HF: r1=1.81, r2=0.75
For F+H2: r1=0.75, r2=1.81
The obtained values are very close to the initial F + H2 situation, which is in agreement with Hammond's Postulate, as both reactions will have transition states resembling the F + H2 system.
 |
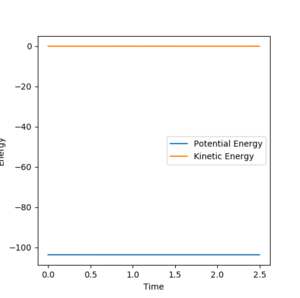 |
The activation energy is the energy needed by the reactants in order to reach the transition state; therefore, it is the energy difference between the transition state and the energy of the reactants. As the transition state corresponds to zero kinetic energy, Just being a bit picky as a scientist when we use the words to describe. Yes, you did use zero kinetic energy to work out the TS, but 'TS corresponds to zero kinetic energy isn't always true.' Think about most reactions and some other tests you did with the program, is the KE always zero when the system passes the TS point? --Sw2711 (talk) 11:53, 11 May 2018 (BST)
all of the energy at this point will be potential. The energy of the transition state was found to be -103.742. To find the activation energy, the difference in potential energy between the transition state and the reactants needs to be calculated. To obtain the reactants'energies, the systems are slightly shifted from the transition state equilibrium, to yield a reactive reaction pathway in the MEP calculation ( For F+H2: r1=0.75, r2=1.71, For H+HF: r1=1.71, r2=0.75).
 |
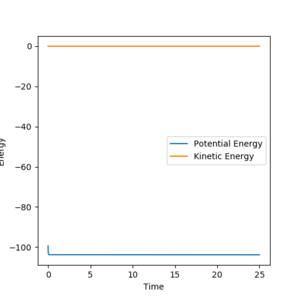 |
As the F-H-H system is already close to the transition state, it is expected that the activation energy for the exothermic process is very small, which is confirmed by the GUI calculations. However, the H-H-F system describes an endothermic reaction, so its activation energy is higher than for the previously discussed system.
Reaction Dynamics
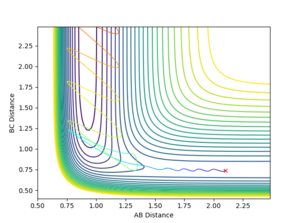
The following set of conditions was found to yield a reactive pathway for the F-H-H system: r1=0.74, r2=2.1, p1=-1.0, p2=-1.5, see Figures 14 and 15.
 |
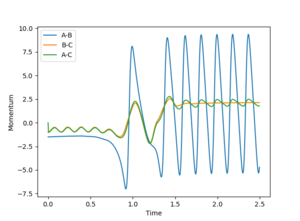 |
In Figure 15, it can be seen that at the beginning (t=0.0-0.75s) the H-H molecule (B-C on the plot) oscillates, whilst the fluorine atom is too far away from the H-H system for the F-H bond (A-B) to oscillate. After the collisions, the H-F molecule is formed and will oscillate very strongly. Energy is conserved, therefore the energy released in this exothermic reaction will be converted from potential energy (the energy the system initially had) in kinetic energy, which will be transferred to the obtained lone H atom and HF molecule; both of these oscillate faster than the initial system, even if HF has a greater reduced mass than H2. This can be confirmed experimentally by measuring the bond vibrations using IR spectroscopy.
We need a bit more explanation how IR could be used to measure the bond vibrations.--Sw2711 (talk) 11:54, 11 May 2018 (BST)
F-H-H system
If a calculation is setup so that r1=0.74, r2=2.1, p2=-0.5 and we vary p2 in the (-3;3) range (values chosen as close to the extremities as possible), it is observed that H-H momentum values close to -3 and 3 will lead to a vigurously oscillating H-H bond; the system reaches the transition state, but does not have enough energy to go past the saddle point, and thus rolls back to the reactants chanel. Since the initial system has energy (oscillating bonds) and energy must be conserved, at the end of the process, the particles will still oscillate (Figure 16). If the H-H momentum is low and the F atom collides with a high energy, the contour plot in Figure 17 is obtained: the system can now overcome the energy barrier and proceed to the product channel.
 |
 |
If the momenta are changed so that p1=0.1, p2=-0.8, then the obtained trajectory describes a reactive pathway: the particles now reach the transition state and are able to cross the energy barrier towards the products (Figure 18).
 |
H-H-F system
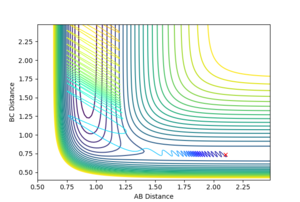
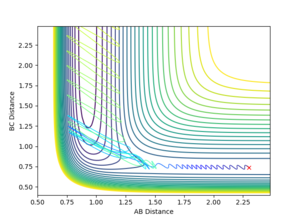
Subsequently, the H-H-F system was analysed by setting the initial conditions at the bottom of the H-F energy well (r1=0.91, r2=2.3, p1=1.0) and a very high momentum value for the colliding hydrogen atom ( p2=-3.0). The result is shown in Figure 19. Further, the momentum of the lone H atom was decreased and the momentum of the H-F bond was significantly increased (p1=10, p2=-0.9), and the resulting contour plot can be observed in Figure 20.
 |
 |
Polanyi's Rules
Polanyi's Empirical Rules differentiate between the roles of translational and vibrational energies in promoting a reaction; the rules state that translational energy promotes an early-barrier reaction (where the transition state resembles the reactants), while vibrational energy promotes a late-barrier reaction (the transition energy resembles the products) [5].
These rules can be illustrated with the 2 systems discussed above, F-H-H and H-H-F. F-H-H describes an exothermic reaction, where the transition state resembles the reactants greatly. Therefore, Polanyi's Rules state that in this case, the reaction is promoted by translational energy. On the other hand, the H-H-F system is endothermic, the transition state is similar to the products, thus the energy involved in this reaction is vibrational.
Analysis of Figures 16, 17, 19 and 20 shows that Polanyi's Rules hold for the F-H-H and H-H-F systems.
For F-H-H, setting the vibrational energy of the H-H bond high and the kinetic energy Do you mean translational energy here? --Sw2711 (talk) 11:58, 11 May 2018 (BST)of the F atom low results in a non-reactive pathway (Figure 16); however, reversing the conditions (low vibration, high translational energy) leads to the reactive trajectory seen in Figure 17. This system obeys the Polanyi Rules as for an exothermic process the translational energy will be efficient in promoting the reaction.
In the situation pictured in Figure 19, the H-F bond has a low vibration and is hit by a hydrogen atom with a high kinetic energy; the system does not have enough energy to reach the transition state, therefore it rolls back in the reactants channel. This can be explained by Polanyi's Rules as the H-F bond does not have much vibrational energy in this situation, so it cannot reach the late-barrier transition state. However, Figure 20 shows that upon a great increase in the H-F vibration, even a low-energy hydrogen atom can collide successfully with the HF molecule to yield the products; this is because the reaction is driven by the vibrational energy of the system, which is now high enough to promote the reaction.
Further experiments can be done to confirm whether Polanyi's Rules hold for other elements as well. Therefore, the same computational methods could be run on the GUI for Cl-H-H/H-H-Cl and I-H-H/H-H-I systems and the results can be checked against the theory.
References
- ↑ H. P. Hratchian, H. B. Schlegel, Theory and Applications of Computational Chemistry, Elsevier, 2005, 195-249
- ↑ 2.0 2.1 P. Atkins, J. de Paula, Atkins' Physical Chemistry, Oxford University Press, 2014, 894-902
- ↑ 3.0 3.1 http://www4.ncsu.edu/~shultz/Common_Bond_enthalpies.pdf (accessed 03.05.2018)
- ↑ G. S. Hammond, J. Am. Chem. Soc., 1955, 77 (2), 334–338
- ↑ Z. Zhang, Y. Zhou, D. H. Zhang, G. Czakó, J. M. Bowman, J. Phys. Chem. Lett., 2012, 3 (23), 3416–3419

