MRD:dialekticnomaterialisticen
H + H2 System
Transition State
On a potential energy surface diagram, how is the transition state mathematically defined? How can the transition state be identified, and how can it be distinguished from a local minimum of the potential energy surface?
The transition state is mathematically defined as a saddle point on the potential energy surface diagram. We can identify it as the point where the gradient of the potential is zero for both coordinates i.e. ∂V(ri)/∂ri=0.
Additionally, the saddle point has zero curvature, which enables us to distinguish it from local minima. We do so by determining if the inequality below holds true.
< 0
As such, the saddle point is a maximum on the minimum energy path (along the "reaction coordinate"), but a minimum in the direction orthogonal to it. Yes. Good. Mak214 (talk) 18:42, 13 May 2020 (BST)
Report your best estimate of the transition state position (rts) and explain your reasoning illustrating it with a “Internuclear Distances vs Time” plot for a relevant trajectory.
In the case of a symmetric system such as H - H - H, the potential energy surface diagram has a symmetry along the r1 = r2 axis. Therefore we know that the transition state is the minimum point on the line r1 = r2. Given no initial momentum, the system will oscillate on this axis, and the minimum i.e. the transition state, is obtained by finding the point where the oscillation does not occur. Plotting the internuclear distance vs time, we expect constant values (no change in internuclear distance with time) for the transition state.
The transition state position rts is given approximately as r1 = r2 = rts = 90.77 pm.

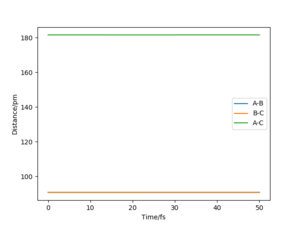
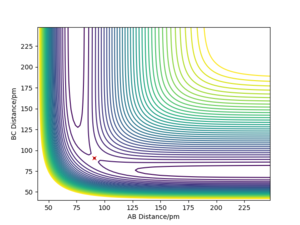
Nice response. Mak214 (talk) 18:42, 13 May 2020 (BST)
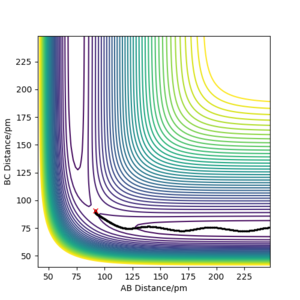
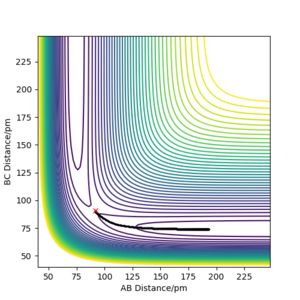
Comment on how the mep and the trajectory you just calculated differ
When calculating the minimum energy path, the momentum of the particles is set to zero after each step, resulting in a motion following the trough of the potential energy surface. On the other hand, the dynamics simulation retains the momentum gained by movement from previous steps, which results in some of the energy being converted to vibrational energy - oscillations are observed. Clear and concise. Well written response. Mak214 (talk) 18:42, 13 May 2020 (BST)
Reactive and Unreactive Trajectories
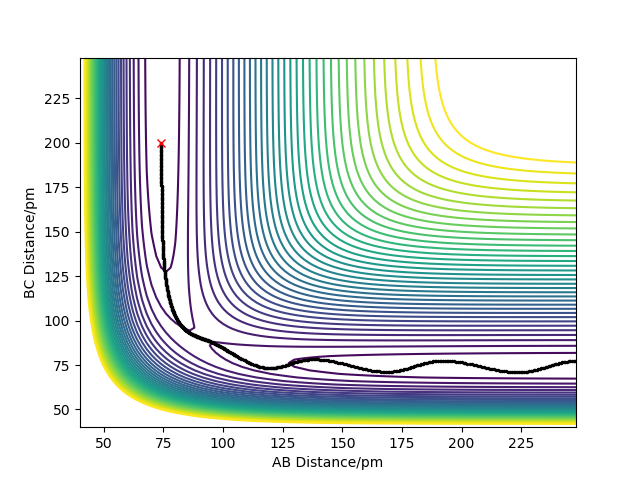
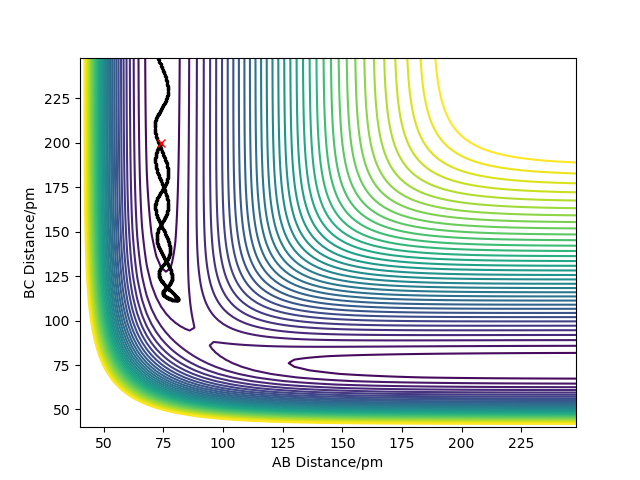
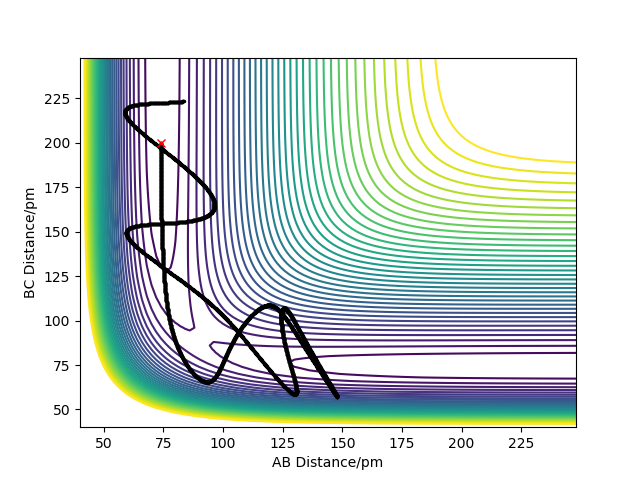
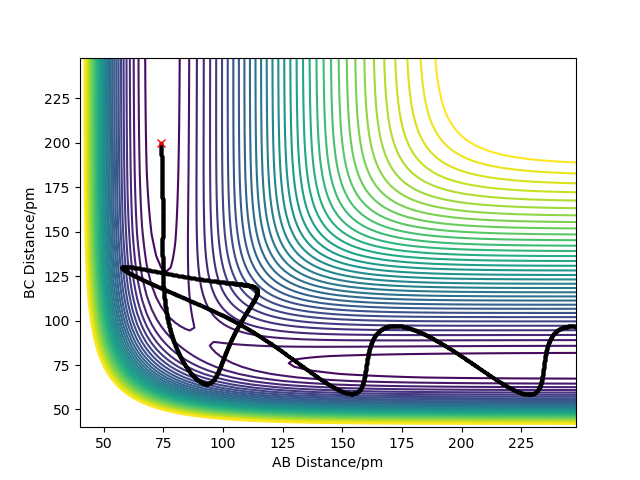
Complete the table below by adding the total energy, whether the trajectory is reactive or unreactive, and provide a plot of the trajectory and a small description for what happens along the trajectory. What can you conclude from the table?
The analysis of the trajectories in the table above shows that the absolute amount of energy is not the only factor determining the success of a reaction. Additionally an appropriate distribution of the energies between translational and vibrational modes is required for a successful reaction to occur..
Good analysis. Mak214 (talk) 18:45, 13 May 2020 (BST)
Given the results you have obtained, how will Transition State Theory predictions for reaction rate values compare with experimental values?
In the rate constant estimate given by Transition State Theory, all trajectories with sufficient kinetic energy along the reaction coordinate are considered to lead to completion. Given the findings above, where in systems with sufficient kinetic energy system recrossing can occur, we conclude that Transition State Theory overestimates the rate of reaction compared to experimental values. Yes. There is further discussion to be had here. Look at the suggested reading for this lab. What about quantum effects like tunnelling? Is this considered in TST? Mak214 (talk) 18:45, 13 May 2020 (BST)
F - H - H System
By inspecting the potential energy surfaces, classify the F + H2 and H + HF reactions according to their energetics (endothermic or exothermic). How does this relate to the bond strength of the chemical species involved?
The reaction of a fluorine atom with a hydrogen molecule is exothermic, while the reverse is endothermic. We obtain this information by considering the depth of the potential which is much deeper for shorter F-H distances than for shorter H-H distances. This is directly related to the bond strength of the involved species. The energy required to break a H-H bond is 436 kJ mol-1, and the energy required to break a H-F bond is 569 kJ mol-1 [1]. The reaction forming HF therefore releases 133 kJ mol-1 while the reverse requires this much additional thermal energy. Good. Thank you for including a reference here to contextualise your results. Mak214 (talk) 18:47, 13 May 2020 (BST)
Locate the approximate position of the transition state.
Finding the transition state is difficult as the F + H2 reaction has a low activation energy. Using Hammond's postulate we can improve our guesses by proposing that our transition state has a relatively shorter H-H distance and relatively longer H-F distance (compared to the H-H-H case). The transition state is located at the point with a H-H distance of 74.5 pm and a H-F distance of 181.1 pm. Notice that the H-H distance is very similar to the H-H bond length in H2 which is 74.14 pm [2]. Good. Mak214 (talk) 18:47, 13 May 2020 (BST)
Report the activation energy for both reactions.
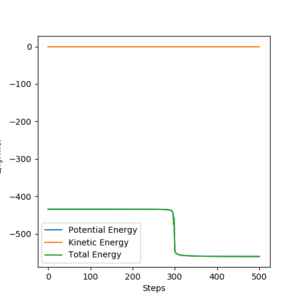
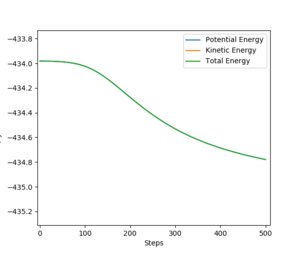
By plotting the energy as a function of time and calculating the Minimum Energy Path from a position, close to the transition state, we can obtain a reasonable estimate for the activation energy of both the forward and backward reactions. We do this by subtrating the reactant minimum energy from the transition state energy.
The transition state energy is -433.980 kJ mol-1.
The energy of F + H2 is -560.093 kJ mol-1.
The enrgy of HF + H is -435.032 kJ mol-1.
The activation energy of the F + H2 reaction is 1.052 kJ mol-1.
The activation energy of the reverse reaction is 126.113 kJ mol-1.
Yes. Well done. Mak214 (talk) 18:47, 13 May 2020 (BST)
In light of the fact that energy is conserved, discuss the mechanism of release of the reaction energy. Explain how this could be confirmed experimentally.
Discuss how the distribution of energy between different modes (translation and vibration) affect the efficiency of the reaction, and how this is influenced by the position of the transition state.
A good understanding and well written responses. Report is not complete. Some reading around the subject would help to bulk out discussions. Remember to reference theory too, as well as experimental values to contextualise your own results. A very good job with what was attempted. Mak214 (talk) 18:49, 13 May 2020 (BST)
Bibliography
[[1]] Chemistry LibreTexts, chapter 3.7 Bond Energies and Enthalpies [[2]] Experimental data for diatomic hydrogen

