MRD:dhk3517
Exercise 1
1. On a potential energy surface diagram, how is the transition state mathematically defined? How can the transition state be identified, and how can it be distinguished from a local minimum of the potential energy surface?
Differentiate the potential energy curve to get the minimum energy curve (black line on the surface diagram), differentiate again (i.e. differentiate the minimum energy curve) and equate to zero to find where the gradient is zero (either maximum or minimum point), differentiate the third time and substitute coordinates found from the second derivative, if it is negative it proves that the point found is a maximum. Hence, that point is the transition state. Another way if to differentiate the potential energy curve with respect to Q1 and Q2. Equate both differential equations to zero to find where the gradient is zero for both. Q1 would have a minimum point while Q2 has a maximum point. The intersection of Q1's min and Q2's max is the transition state.
There is some confusion here, the transition state is found when ∂V/∂r1 and ∂V/∂r2 is equal to zero and at the local maximum when ∂2V/∂q22 is less than zero, where q2 is a tangent in the direction of the reaction path. Also, what is Q1 and Q2? These need defining. And if you mention a characteristic of the surface diagram (ie the black line) you should show the diagram as an image. Sf3014 (talk) 21:12, 21 May 2019 (BST)
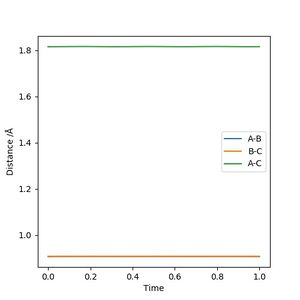
2. Report your best estimate of the transition state position (rts) and explain your reasoning illustrating it with a “Internuclear Distances vs Time” plot for a relevant trajectory.
0.9075 Å
The reactant and product are the same molecule so the transition state resembles the reactant as much as it does the product. Therefore, according to the Hammond postulate, it is neither an early or late transition state which explains that the transition state has equal bond lengths between the three hydrogen atoms. The transition state is where the molecules are not vibrating, hence the horizontal lines in the internuclear distances vs time graph. The horizontal lines also suggest that the atoms are not "rolling into" the side of products or reactants at which point is said to be the transition state.
Good. It's good practice to reference where you got your information from on Hammond postulate. Sf3014 (talk) 21:19, 21 May 2019 (BST)
3. Comment on how the mep and the trajectory you just calculated differ.
Dynamic considers the residual momentum the molecules have while MEP only considers the momentum the molecules would have that exact moment or position without any residual momentum. This explains why the path of the dynamic is curly while MEP is straight; dynamic state has momentum which leads to vibrations causing contractions and elongations of bonds while MEP does not have this quality. Also, the dynamic ranges further than MEP due to the residual momentum dynamic state has.
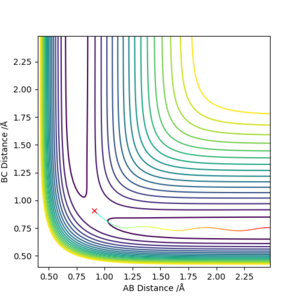

Good but the comment on the minimum energy pathway (MEP) calculation is not clear. MEP gives a trajectory for a momenta of zero which you can see through your momenta vs time graph. Sf3014 (talk) 21:26, 21 May 2019 (BST)
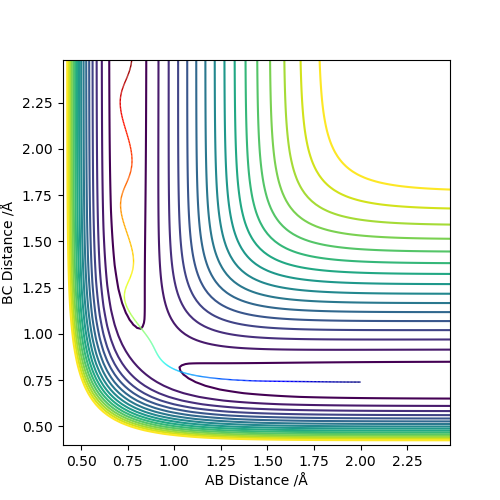
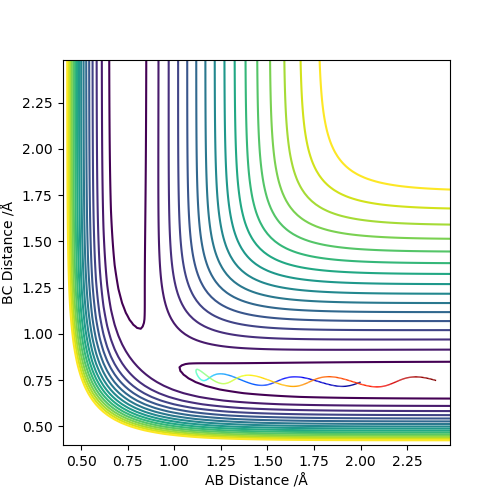
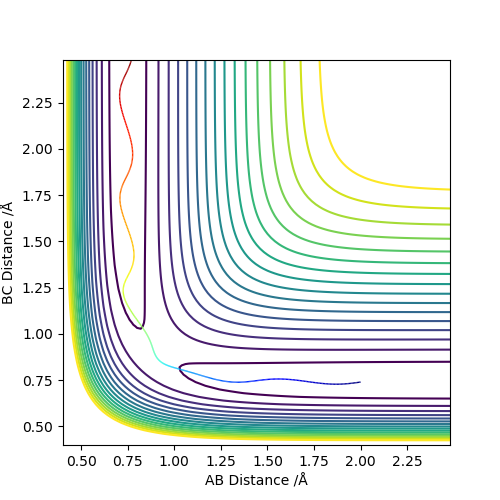
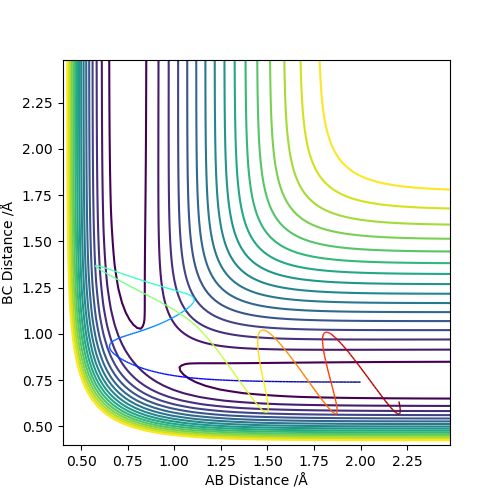
4. Complete the table above by adding the total energy, whether the trajectory is reactive or unreactive, and provide a plot of the trajectory and a small description for what happens along the trajectory. What can you conclude from the table?
From the table, we can see how the reactivity is related to the total energy. The total energy must be of certain balance so that the BC bond can be broken and AB bond can be formed and stable enough to go back to BC. Good observations in your table, maybe next time include some observations on the reaction trajectory. Also, how is the reactivity related to the total energy? What is the trend? Sf3014 (talk) 21:34, 21 May 2019 (BST)
5. State what are the main assumptions of Transition State Theory. Given the results you have obtained, how will Transition State Theory predictions for reaction rate values compare with experimental values?
The main assumptions of the transition state theory is that the reactants have energies which are Boltzmann distributed and that once it reaches the transition state, it will not collapse back to the state of the reactants.[1]
The transition state theory predictions would match the values for conditions 1 to 3 in the question above as they either form products from the reactants directly or do not breakdown from the state of reactants. However, for conditions 4 and 5, the reactants passes the transition state but goes back to the reactant stage at least once which does not agree with the assumption of the transition state theory and hence the experimental values may not follow the predictions. Well done but in what way will the experimental values differ? How will it effect the rate of the reactions. Sf3014 (talk) 21:38, 21 May 2019 (BST)
Exercise 2
6. By inspecting the potential energy surfaces, classify the F + H2 and H + HF reactions according to their energetics (endothermic or exothermic). How does this relate to the bond strength of the chemical species involved?
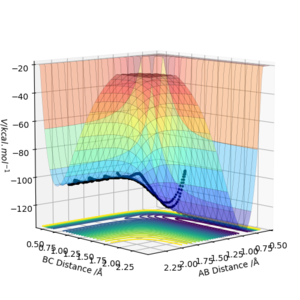
As seen in the graphs, H2 + F is exothermic and HF + H is endothermic. HF has a stronger bond than H2 due to the electronegativity difference between H and F which contributes to the ionic interaction of the molecule. Hence, energy is needed to break this bond while energy is released when making this bond.
Okay but you should describe the potential surface and explain why one direction is exothermic while the other is endothermic. You should define A, B and C in your image. Also, some comparison of reported bond energies for HF and H2 would be good. Sf3014 (talk) 21:44, 21 May 2019 (BST)
7. Locate the approximate position of the transition state.
AB 1.8A BC 0.74A

How did you get these positions? Some description is needed. Sf3014 (talk) 21:47, 21 May 2019 (BST)
8. Report the activation energy for both reactions.
energy vs time step size 10000
H2 103.8 - 131.9
HF 132.579 - 132.974
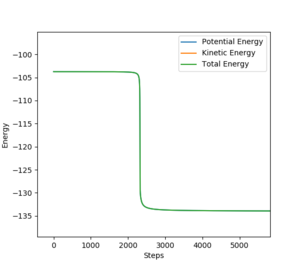

9. In light of the fact that energy is conserved, discuss the mechanism of release of the reaction energy. Explain how this could be confirmed experimentally.
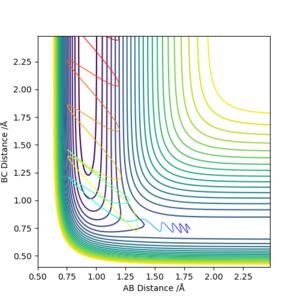
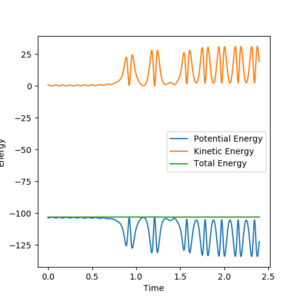
H2 + F is reactive when AB distance is 1.8A, momentum is -0.5 and BC distance is 0.74A and momentum is 0.555. In the energy vs time curve, the energy conservation is shown as when the potential energy is at its maximum, the kinetic energy is at its minimum and when the kinetic energy is at its maximum, the potential energy is at its minimum and the total energy of the system does not change.
10.Discuss how the distribution of energy between different modes (translation and vibration) affect the efficiency of the reaction, and how this is influenced by the position of the transition state.
Polanyi's empirical rules state that vibrational energy is more efficient for a reaction with a late transition state while translational energy is better at promoting a reaction with an early transition state.[2]
Good, but how does this compare to your reaction trajectories?. Sf3014 (talk) 21:53, 21 May 2019 (BST)

