MRD:dc3415wikireport
Molecular reaction dynamics of triatomic systems
Notation
In all the calculations below, rBC and pBC refer to the internuclear distance and momentum of the molecule respectively. rAB and pAB refer to the internuclear distance and momentum between the individual atom A and atom B which is part of the molecule.
H2 + H system
Initial conditions
The initial system was ran with the atoms in H2 labelled as B and C and the Hydrogen atom labelled as A. The internuclear distance of the hydrogen molecule, rBC, was set to 0.74Å and the momentum, pBC, was set to 0. The internuclear distance between the hydrogen molecule and the hydrogen atom, rAB, was set to 2.30Å and the momentum, pAB, was set to -2.70.
When the potential energy surface reaches a minimum the total gradient will be 0. Since the transition state is a maximum on the minimum energy path between reactants and products, a transition structure will also have a total gradient of 0. The two can be differentiated by taking the second derivatives and looking at their signs. A minimum point will have a positive second derivative while a maximum point will have a negative one.
(This is only for one coordinate (in the case here, the reaction coordinate). What about for an N-coordinate system? Tam10 (talk) 14:35, 31 May 2017 (BST))
Identifying the transition state
In order to identify the transition state, the internuclear distances rAB and rBC were set equal and the momenta pAB and pBC were set to 0. The internuclear distances were varied but kept equal for both AB and BC starting from a distance of 2Å and then decreasing the distance until the reaction pathway on the surface plot gave only a small dot, the atoms in the Animation mode appeared almost inanimate and the internuclear distance in the Internuclear Distances vs Time plot appeared to be almost completely flat. The best estimate obtained for the transition state position, rts was 0.908Å.

From the Internuclear Distance vs Time plot in Figure 1 it is seen that rAB and rBC remain almost constant with increasing time unit. Since a transition state occurs at an energy maximum and given that the atoms possess no momentum, the transition state is a point of infinite potential energy. This is demonstrated by the constant kinetic energy which is obtained at rts=0.908Å
(This does not mean infinite potential energy! And infinite potential energy is not demonstrated by constant kinetic energy. The kinetic energy of your calculation should be zero throughout because the gradient is zero and you started with no kinetic energy. Tam10 (talk) 14:35, 31 May 2017 (BST))
Comparing minimum energy path (mep) calculations to Dynamics calculations
The MEP for the reaction was calculated by keeping the same initial conditions as described above but changing rBC by +0.01Å to 0.918Å, increasing the number of steps to 2000 and the calculation type to MEP. By looking at the surface plot of the MEP calculation the trajectory appears to be flat along the floor of the plot. The MEP calculation resets the gradient of the calculation to zero at each step thus allowing the reactants to follow a minimum energy pathway that results in zero kinetic energy being observed in the Kinetic energy vs Time plot. In other words, the potential energy of the reactants is set to the maximum at the beginning of every step, ensuring that the path followed is the minimum energy path.
(No. The velocity is set to zero, not the gradient. The last sentence is also wrong. Tam10 (talk) 14:35, 31 May 2017 (BST))
The Dynamics calculation shows the potential energy changing in an continuous manner since the reactants can have enough energy to go uphill after the minimum has been reached. Since the gradient does not reset at the end of every step, the potential energy is no longer infinite and can convert to kinetic energy allowing for the reactants to go uphill.
(No. Tam10 (talk) 14:35, 31 May 2017 (BST))
By reversing the bond distances so that rAB=0.918Å and rBC=0.908Å, the reverse reaction occurs. rAB increases and rBC oscilates close to 0.78Å. The final positions rAB and
rBC after 10 seconds were found to be 0.733Å and 36.85Å respectively. The final momenta, pAB and pBC were 1.22 and 2.48 respectively.
A calculation was set up so that the final position parameters were used as the initial parameters and the final negative momenta were used as the initial momenta. By inspection of the surface plot, it appears that the molecule and the atom collide but no reaction occurs after collision. The momenta appear to become positive after collision and reach the same magnitude in the positive direction. The internuclear distance rAB appears to remain the same and is slightly elevated at the moment when the internuclear distances between AB and BC become the same. After that, the internuclear distance AB keeps increasing.
(Any explanation for this? Did you give it enough steps? Tam10 (talk) 14:35, 31 May 2017 (BST))
Dynamic calculations to predict the reactivity of pathways
The reactivity of pathways with rBC=0.74Å and rAB=2.0Å and varying momenta was investigated. Table 1 below summarises the findings:
| pBC | pAB | Reactivity |
|---|---|---|
| -1.25 | -2.5 | Reactive |
| -1.5 | -2.0 | Unreactive |
| -1.5 | -2.5 | Reactive |
| -2.5 | -5.0 | Unreactive |
| -2.5 | -5.2 | Reactive |
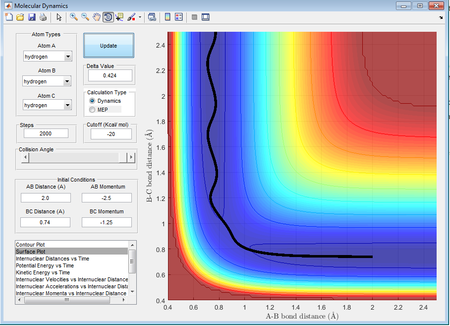
In this case it can be seen that as the hydrogen atom A approaches the hydrogen molecule, rAB decreases while rBC appears to be relatively constant at 0.74Å. There is very little vibrational energy at this point. Once the HA approaches at a distance of around 1.2Å, rBC begins to increase. After collision, the product appears to vibrate more compared to the reactants. rBC increases, indicating that the reaction trajectory is reactive resulting in the formation of HA-HB and HC as a single atom.

From the trajectory above it can be seen that rBC remains relatively constant, but with a higher vibrational energy compared to the case above. After the moment of collision rAB appears to increase again while rBC still remains fairly constant. This suggests that the collision does not result in reaction hence the reaction trajectory is unreactive. The potential energy of the vibrations is very similar before and after collision.
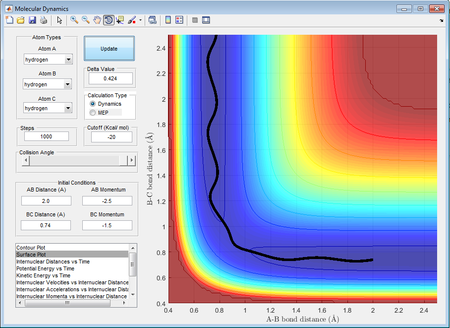
This set of momenta results in a reactive trajectory as it can be seen by the shape of the surface plot, which is similar to case 1. rAB decreases and when the two reactants come close to each other, reaction occurs resulting in HAB being formed which vibrates at a slightly higher energy than the reactants. rBC appears to increase which is consistent with the formation of HA-HB + HC.
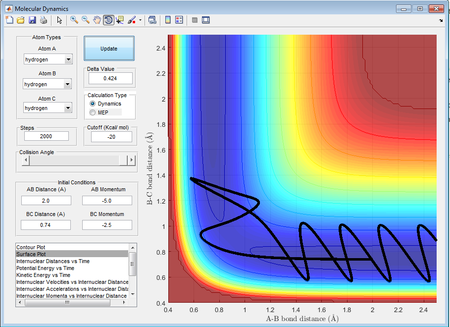
This trajectory shows an initial reaction as rAB decreases and after collision, rBC increases. However the products are quickly reverted back to reactants as the products recross the activation barrier. This is due to the high kinetic energy of the system as a result of the large momenta of the molecules. The higher energy can be also seen by the large vibrations resulting in large potential energy wells. This return to the reactants results in this trajectory being essentially unreactive. After recrossing the barrier, the energy of the system is significantly reduced, as seen from the decrease in potential energy and the size of the wells.

This trajectory is a reactive trajectory. A reaction takes place as HA approaches the hydrogen molecule. Initially there is very little vibrational energy however once the reaction occurs, the HC atom appears to be vibrationally excited as rBC increases.
(No, the single atom cannot be vibrationally excited. It's the AB atoms that are vibrating. Tam10 (talk) 14:35, 31 May 2017 (BST))
Transition state theory
Transition state theory assumes an equilibrium between the reactants and the transition state complex. It uses the Eyring equation[1] to allow the calculation of the rate constant of a reaction using statistical thermodynamics. The calculation of a partition function for an activated complex or a transition state can be difficult especially in the case where there is limited information available for the reaction or its mechanism. Transition state theory relies on multiple assumptions such that the atoms and molecules involved behave according to classical mechanics[2] and are treated as hard spheres. Transition state theory assumes that a specific amount of energy is required before a collision can lead to the formation of a transition state and then products, otherwise the collision will not have enough energy to lead to product formation. In reality, quantum mechanical processes such as barrier crossing can cause product formation between particles with energy lower than the activation energy. While it is known that there are multiple activated complexes that can occur with different energies, transition state theory states that only the lowest energy activated complex (the transition state) will lead to product formation and all other pathways will not. While this is true at low temperatures, at higher temperatures much more energy is available in the system and the reaction rate might no longer be in direct control of the transition state pathway[3]. Transition state theory would not have predicted the correct outcome for the 4th case and the 5th case which involve barrier recrossing since it assumes that once the transition state turns to products, it would stay as products.
F - H - H system
Thermodynamics and PES inspection
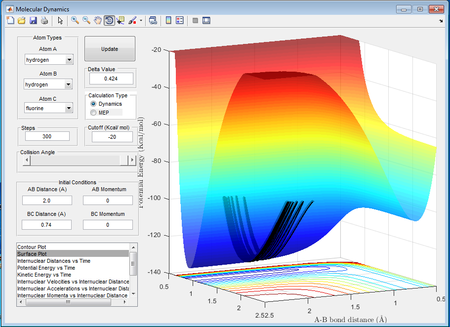
There are 2 possible reactions in the H - H - F system. One is the reaction between H2 and F and the reverse reaction is between HF and H. By inspection of the H2+F surface plot it can be seen that this reaction is exothermic since the overall potential energy of HF + H is lower than the reactant H2 + F. This can be seen in Figure X. Conversely, the reverse reaction is endothermic, since the overall potential energy of H2 and F is greater than the energy of HF + H as seen in figure Y. The enthalpy of a reaction depends on the bonds that are being broken (endothermic process) and the bonds being formed (exothermic process). Since the enthalpy change of the reaction, ΔH, is the difference between the bonds being broken and the bonds being formed, in the case of the exothermic reaction, the energy required to break the H2 bond is less than the energy released during the formation of the H-F bond hence the overall sign of ΔH will be negative. Thus it can be concluded that H-F has a stronger covalent bond than H2.
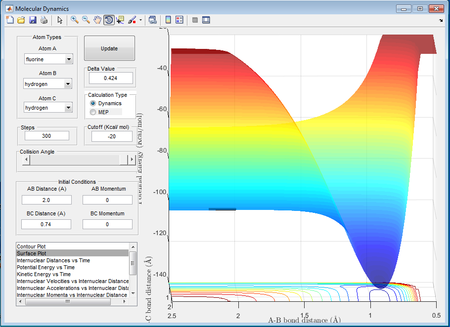
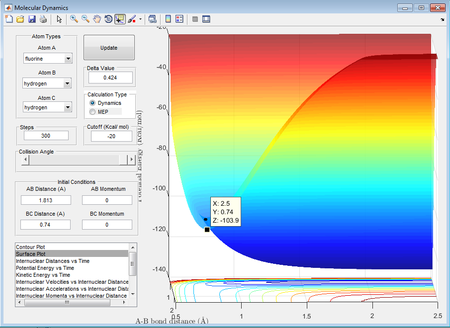
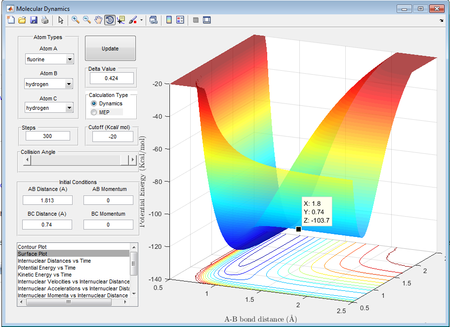
With reference to the Hammond postulate, the transition state is much closer in energy to the reactants, therefore it will resemble closely to the reactants. The aproximate position of the transition state for the exothermic reaction was found to be at rBC=0.74Å and rAB= 1.813Å.
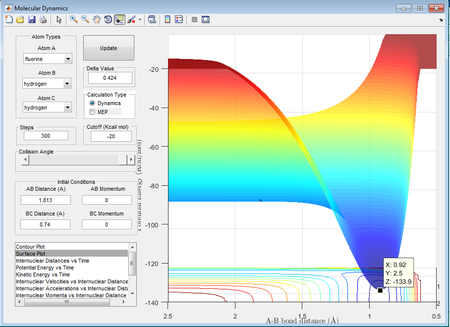
The activation energies for each reaction were calculated for both reactions by subtracting the energy of the reactants from the energy of the transition state. The activation energies (Ea) of each reaction are reported below:
H2 + F: -103.7-(-)103.9= 0.2kcal/mol = 0.8368 kJ/mol
HF + H: -103.7-(-)133.9= 30.2kcal/mol = 126.3568 kJ/mol
Reaction dynamics: F + H2
A set of initial parameters that led to a reaction was identified with rBC=0.74Å, rAB=1.8Å, pBC=-2.0 and pAB=0. The surface plot and internuclear momenta vs time plot of the initial set of conditions is shown below:
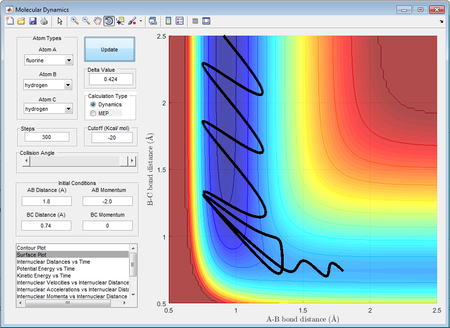

The law of conservation of energy states that the total energy of a system remains unchanged i.e. the individual forms of energy may change however the total energy will remain constant. By observation of the internuclear momenta vs time plot, it is seen that pAB which is initially -2, increases after collision with the hydrogen molecule and is now changing between -5.56 and 9.35. In contrast, the momentum of the molecule, which was originally changing between -2 and 0 as a result of vibrations of the bond is now at a constant momentum of 2. This demonstrates the change between the potential energy, which is a result of the internuclear distances and attractions, and the kinetic energy that is due to the momentum of the molecule. Since the momenta change after the collision, so does the kinetic energy of the molecules. The "excess" energy of the reaction is converted to heat energy and is released to the surrounding environment of the reaction. A calorimetric experiment using a bomb calorimeter can be conducted to measure the change in temperature of the reaction as it occurs. The change in temperature can then be related to ΔH using the fundamental equation dH=dU+PdV+VdP and adapting it to include the temperature change term.
When pBC was changed in the range of -3 to 3, at pAB=-0.5, rBC=0.74Å and rAB=1.8Å most of the momenta resulted in a reactive trajectory. The majority of the reactive trajectories at high momenta resulted in vibrational excitation of the product molecule, demonstrated by the increase in the height of the peaks along the rBC axis after the products were formed.
When pAB was increased to -0.8 and pBC to -0.1 a reactive trajectory was obtained, however the vibrational excitation of the product molecules was significantly reduced.
Reaction dynamics: HF + H
A set of initial conditions was established starting from the bottom of the channel (rBC=0.91Å, pBC=0 and rAB=2.5Å, pAB=-10.0) to simulate a collision between a molecule of HF and a high kinetic energy H atom. The reaction appears to be reactive and at the moment of collision, there is initial a decrease in rAB to 0.56Å due to the high kinetic energy of the colliding molecule. The potential energy then spikes producing a potential energy maximum as rAB increases to 1.02Å. After this maximum, the reaction proceeds to product formation with rBC and the potential energy following the path floor.
The pAB was then decreased slowly, so that the kinetic energy of the H atom decreases and rBC was decreased, to increase the potential energy of the HF molecule until a reactive pathway was obtained. The first reactive pathway obtained is shown below:


Polyani's empirical rules discussion
Polyani's empirical rules are used to classify early barriers or transition states that resemble the reactants and late barriers or transition states which resemble the products[4]. In each case, the reactivity and efficacy of reaction trajectory will be different depending on the amount of kinetic energy/translational motion which depends on the momenta of the reactants and the potential energy/vibrational motion which is governed by the internuclear distances in the reactant molecules.
Polyani's rules state that for an early transition state, a higher momentum or translational motion[5] is preferred in order to overcome the barrier whereas in a late transition state a higher potential energy is needed to result in an efficient reaction. The reaction between H2 and F is an example of a reaction which results in an early transition state, therefore a high energy in the form of translational motion would result in a reactive pathway whereas supplying a large amount of vibrational energy and a low translational energy would less likely result in a reactive trajectory despite the fact that the total energy is unchanged and higher than the activation energy.
HF+H has a late transition state, so a high amount of energy supplied as vibrational energy would would increase the efficiency of the reaction. The same effect as explained above would result in the case where most of the energy was supplied in the form of translational energy and the reaction pathway would most likely be unreactive.
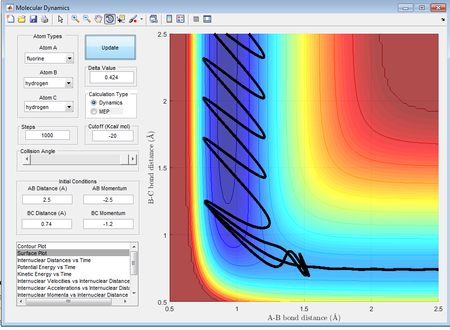
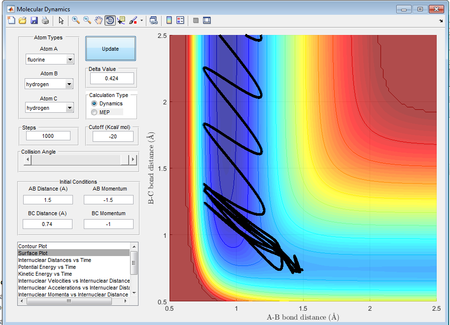
By observation of the two trajectories it is seen that while both of the trajectories are reactive, there is significant recrossing of the activation barrier in the case of the higher vibrational energy which makes the reaction less efficient.
(Why did you change the initial conditions here? It doesn't help that you are already on the product side of the TS Tam10 (talk) 14:35, 31 May 2017 (BST))
References
- ↑ Pechukas, P. Transition State Theory Ann. Rev. Phys. Chern. 1981.32:159-77
- ↑ Atkins, P.; De Paula, J. Physical Chemistry, 9th ed.; W. H. Freeman and Company, 2010
- ↑ Pechukas, P. Transition State Theory Ann. Rev. Phys. Chern. 1981.32:159-77
- ↑ Jiang, B; Guo, H; The Journal of Chemical Physics 138, 234104, 2013
- ↑ Jiang, B; Guo, H; The Journal of Chemical Physics 138, 234104, 2013
