MRD:david.tyoember17
Exercise 1
Surface Plot Setting with Given Variables:
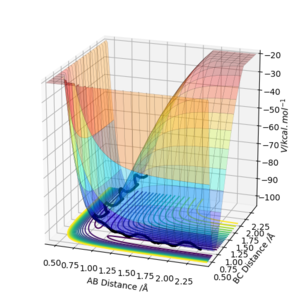
Questions
1.
On a potential energy surface diagram, how is the transition state mathematically defined?
The Transition state is mathematically defined as state corresponding to the highest potential energy - i.e Maxima. The Gradient, dV/d(AB Distance) should be equal to 0, with the second differential of this being less than 0(maxima).
How can the transition state be identified, and how can it be distinguished from a local minimum of the potential energy surface?
(see point above re: second differential(/derivative) - the second differential of dV/d(AB Distance) will be negative at the transition state)
The TS is a maximum on the minimum energy trajectory. i.e. it is a saddle point on the potential energy surface. This is not a clear explanation overall. Mak214 (talk) 17:08, 13 May 2019 (BST)
2.
Report your best estimate of the transition state position (rts) and explain your reasoning illustrating it with a “Internuclear Distances vs Time” plot for a relevant trajectory.
rts = 0.946 Å. Reasoning: This corresponds approximately to the point where the A-B and B-C Distance lines crossed as a function of time during the initial reaction ran.
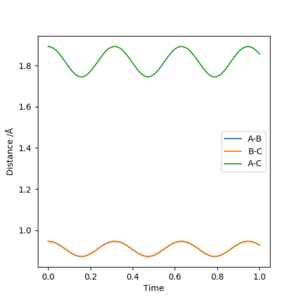
Good. In future it would be worth saying a bit more about the figure you have chosen seeing as it doesn't relate to your explanation, although you are not wrong!! Mak214 (talk) 17:08, 13 May 2019 (BST)
3.
Comment on how the mep and the trajectory you just calculated differ.
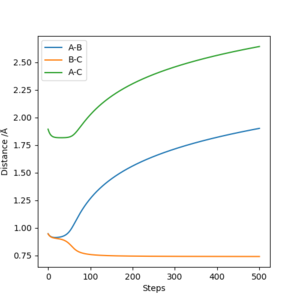
the MEP model does not illustrate the oscillation that is occurring, whereas the Dynamics Model does show the oscillation (See Fig. 3 and Fig. 4 Below). Why? See the script for an explanation about the MEP compared with the Dynamics calculations, the momentum of the particles is reset to 0 after every timestep for an MEP calc. which is why once the particle configurations arrive at a minimum on the potential energy surface they do not oscillate. Mak214 (talk) 17:08, 13 May 2019 (BST)

4. (See Table)
Complete the table above by adding the total energy, whether the trajectory is reactive or unreactive, and provide a plot of the trajectory and a small description for what happens along the trajectory. What can you conclude from the table?
From the table I can conclude that the probability of a reaction occurring can often depend on the momentum of all of the particles involved - and that higher energy/momentum particles/bodies are usually more likely to react(and react fewer times) with other particles/bodies than those with less energy/momentum.
| Plot | p1 | p2 | Etot | Reactive? | Description of the dynamics |
|---|---|---|---|---|---|
| 1 | -1.25 | -2.5 | -100 | Unreactive | The two bodies move closer but no collision occurs, then they move away from each other. ?? Should have reacted at these settings. Mak214 (talk) 17:08, 13 May 2019 (BST) |
| 2 | -1.5 | -2.0 | -100 | Unreactive | The two bodies again move closer to each other, then move away. A-B distance oscillates during this time. |
| 3 | -1.5 | -2.5 | -98.5 | Reactive | The two bodies move closer to each other and then the B-A bond breaks and a B to C bond forms. |
| 4 | -2.5 | -5.0 | -84.30 | Reactive | The A-B Bond breaks after the two bodies move closer together, and a B-C bond forms very temporarily, and then breaks - and then the A-B bond reforms. So overall it was unreactive. Mak214 (talk) 17:08, 13 May 2019 (BST) |
| 5 | -2.5 | -5.2 | -83.11 | Reactive | The two bodies move towards each other, the A-B bond breaks and B temporarily bonds to C, then back to A, then back to C. |
Plot 1
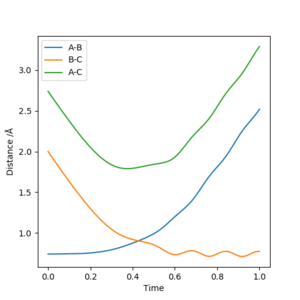
Plot 2
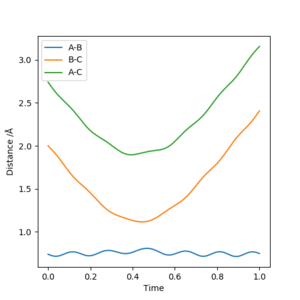
Plot 3

Plot 4

Plot 5
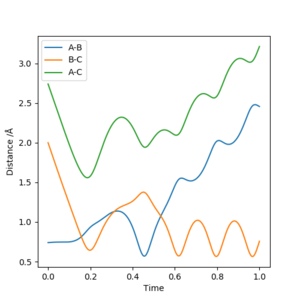
OK. Check your trajectories. Mak214 (talk) 17:10, 13 May 2019 (BST)
5.
State what are the main assumptions of Transition State Theory. Given the results you have obtained, how will Transition State Theory predictions for reaction rate values compare with experimental values?
- It assumes each intermediate is long-lived enough to reach a Boltzmann distribution of energies before continuing to the next step.[1]
- It assumes that atomic nuclei behave according to classic mechanics.[2]
- It assumes the reaction system will pass over the lowest energy saddle point on the potential energy surface.[3]
Under extreme experimental conditions, namely at extremely high temperatures, there will be an increasingly noticeable discrepancy between that predicted and that observed in the experiment.
At relatively low temperatures however, the theory predicts the observed values quite accurately.
But why? How does this relate to your trajectories? You have not really answered the question. Mak214 (talk) 17:11, 13 May 2019 (BST)
Exercise 2
Questions
1.
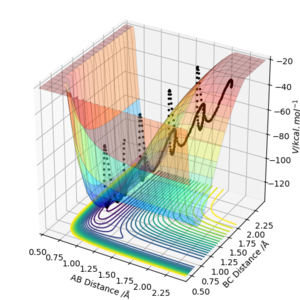
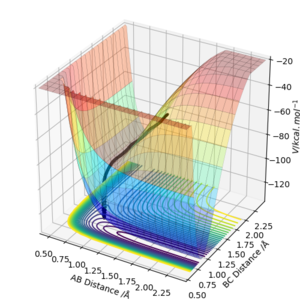
By inspecting the potential energy surfaces, classify the F + H2 and H + HF reactions according to their energetics (endothermic or exothermic). How does this relate to the bond strength of the chemical species involved?
When stronger bonds are formed, more energy is released. Therefore F+ H2 is more exothermic (by far!). Your answers are so brief I can't tell if you have fully understood or not! Be more explicit and state that FH + H is endothermic as you are asked to by the question. Mak214 (talk) 17:14, 13 May 2019 (BST)
2.
Locate the approximate position of the transition state.
3.
Report the activation energy for both reactions.
4.
In light of the fact that energy is conserved, discuss the mechanism of release of the reaction energy. Explain how this could be confirmed experimentally.
5.
Discuss how the distribution of energy between different modes (translation and vibration) affect the efficiency of the reaction, and how this is influenced by the position of the transition state.
References from wikipedia, really? :( There are many references in the script you should refer to to make sure you understand the content of this lab. Mak214 (talk) 17:15, 13 May 2019 (BST)
