MRD:dario01351899mong
Molecular Reaction Dynamics in Triatomic Systems
Transition State in Potential Energy Surface Diagrams
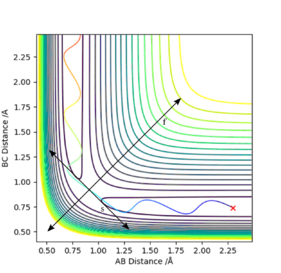
The transition state is defined mathematically on a potential energy surface plot as the maximum saddle point, i.e. on the contour plot below for H + H2, it represents the minimum point of the vector f, ∂²V(rf)/∂(rf)² > 0, and simultaneously the maximum point of the vector s, ∂²V(sf)/∂(sf)² < 0. On the diagram, it is located at the intersection of the two vectors s and f. This also makes sense since it is a point on the graph where rab = rbc, which is a necessary condition for the transition state.
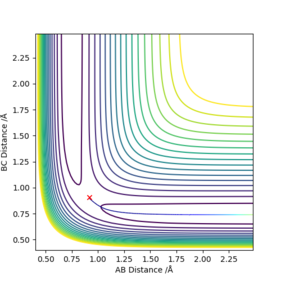
The best estimate of transition state was rts = 0.907742 angstroms. This was obtained by examining an MEP contour plot and making small alterations to the internuclear distances (which are held to be equal to each other), until the path of the trajectory shortens to a negligible amount, implying that the trajectory lies on the maximum point since it doesn't move very far.
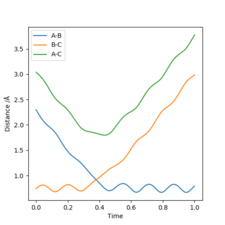
This seems accurate after cross-checking with an Internuclear distance vs Time plot with parameters: rab = 2.3 , rbc = 0.74 , pab = -2.7 , pbc = 0. The crossing point of the A-B plot and the B-C plot represents the transition state, since it is where the internuclear distances are equal. This occurs just below 1.0 angstrom, thus our calculation appears to make sense.
This is a fantastic answer - it is very thorough and clearly explained.Rk2918 (talk) 21:29, 15 May 2019 (BST)
Reactivity of trajectories
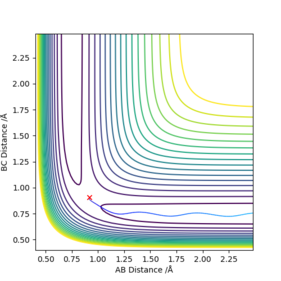
Using a dynamic calculation of reaction path provides a more realistic approach to the motion of the atoms in this reaction than MEP. In MEP, kinetic energy is assumed to be 0. This means that as potential energy decreases towards its minimum at the equilibrium distance, this is not compensated by kinetic energy and hence instead of momentum causing the molecule to travel up the potential energy curve at small bond distance, it remains at the potential energy minimum, meaning no vibration occurs. This means that in the contour plots shown below, the dynamic calculation, the molecule vibrates and thus the trajectory oscillates before reaching the TS, but this does not occur for MEP.
By altering the momentum of the molecules we are able to analyse the contour plots to establish whether a given set-up gives a reaction or not. If it is reactive, the reactants travel through the TS and continue onto product, following a trajectory through the potential well given by the plot. If it is not reactive, then the reactants will approach the TS but won't have enough energy to overcome the energy barrier, causing it to return back to the reactants along the same potential well.
| p1 | p2 | Etot | Reactive? | Description of the dynamics |
|---|---|---|---|---|
| -1.25 | -2.5 | -99.182 | Yes | Reactants travel smoothly through the TS, beginning to vibrate noticeably after the saddle point |
| -1.5 | -2.0 | -100.619 | No | Reactants are vibrating noticeably before reaching the TS, but cannot overcome the activation energy and at around rab 1.1 A turn back and reform the reactants |
| -1.5 | -2.5 | -99.119 | Yes | Reactants are vibrating slightly before reaching the TS, which they pass through directly and overcome, and then begin to vibrate more on forming products. |
| -2.5 | -5.0 | -85.119 | Yes | Reactants A enters with a lot of momentum, causing the trajectory to ricochet off the walls of the potential energy surface and eventually take the path back to reactants, vibrating a lot, and then turning back on itself and recrossing the barrier to form the products, travelling through the TS but then travelling along the sides of the contour back and forth. |
| -2.5 | -5.2 | -83.579 | No | Reactant A enters with even more momentum than previously, and again travels up the walls of the potential energy surface and turns back to the reactants path, vibrating violently along the sides of the contour on its way back to the reactants. |
From this table we can conclude that a reaction only occurs when the momenta of p1 and p2 are well matched, since the 5th reaction of the table demonstrates that simply increasing the momentum in one direction does not necessarily deliver a reaction. It also shows that that the activation energy required to form the products is larger than (more negative) -83.579 kjmol-1, since this was the smallest Etot value that didn't give a reaction.
Transition state theory makes some assumptions (Levine Physical Chemistry 6th Edition):
- all super-molecules that cross the TS become products
- during the reaction, the Boltzmann Distribution of energy is maintained for the reactant molecules
- the supermolecules crossing the TS from the reatant side have a Boltzmann Distribution of energy corresponding to the temperature of the reacting system
This means that experimental values calculated won't match up exactly with the TST predictions due to these assumptions.
You have just touched on the answer here but not quite thought it through quite enough to get there. Drawing on your first point about the fact that all systems that cross TS become products, what does this mean? If TST predicts that systems canont cross back to the reactants side, does it overpredict or underpredict reaction rate?Rk2918 (talk) 21:33, 15 May 2019 (BST)
H2 + F
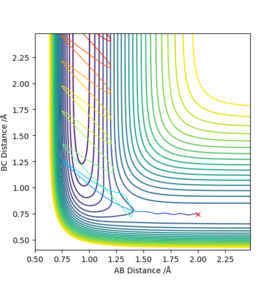
As seen in the PES diagram shown below, the potential well follows a course that leads to an overall decrease in energy, which means that the reaction is exothermic. This means that the products are at a lower energy than the reactants, implying that the H-F bond formed in this reaction is stronger than the initial H-H bond in the reactants.
The approximate position of the TS was found to be rab 1.812438 A , rbc 0.744832 A. This was found by examining the contour plot and making an initial rough guess of its position using the MEP setting. After this variations were made to the interatomic distances until the shortest MEP trajectory was achieved, since this implies that the coordinates set on the contour plot are very close to the TS.
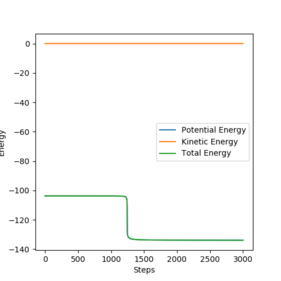
Activation energy was calculated by offsetting one of the interatomic distances calculated above (rab + 0.0003), so that in an MEP plot instead of sitting on the TS we can ensure the trajectory rolls down the maximum back to the potential well of the PES. Observing an Energy vs Time plot then demonstrates this energy difference between TS and reactants, and allows for the calculation of activation energy
-103.751 - (-104.014) = 0.263 kcal.mol-1
HF + H
Conversely, in the PES diagram shown below, the potential well follows a course that leads to an overall increase in energy, which means that the reaction is endothermic. This means that the products are at a higher energy than the reactants, implying that the H-H bond formed in this reaction is weaker than the initial H-F bond in the reactants, maintaining the same observation as made above.
The location of the TS was found to be in a position where the interatomic distances were swapped. This makes sense since the two reactions are the reverse of each other; In H2+F we make a HF bond generate a H atom, and in HF + H we make H2+F. Therefore rab 0.744832 A , rbc 1.812438 A
The activation energy however includes the ΔE of the reaction as well as local maximum of the TS. Therefore we can simply add the activation energy of the previous reaction to the ΔE of the reaction , which was calculated by examining the energy vs time plot for the previous reaction and adding this on.
activation energy = activation energy of H2+F (0.263 kcalmol-1) + ΔE of reaction (-103.752- (-133.945) = 30.193) = 30.456 kcalmol-1
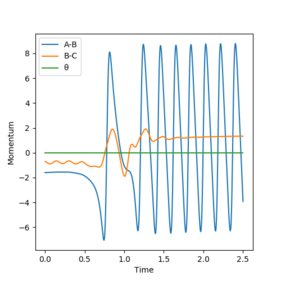
Below is a contour plot for the exothermic reaction H2+F. There is an overall energy decrease from reactants to products, however total energy is conserved. This can be explained by the oscillation observed on the reaction path from TS to products. This energy loss of the system comes from the vibration of the product H-F molecule, indicating by the oscillation but also by the momentum vs time plot which demonstrates this. This extra vibration translates into thermal energy, explaining why exothermic reactions generate heat. The amount of thermal energy generated by the reaction can be recorded by calorimetry.
Polanyi's rules states that vibrational energy is more efficient in promoting a late barrier reaction than translational energy. Late barrier reactions are endothermic (Hammond's postulate), meaning that the HF+F reaction benefits more from vibrational energy (i.e. momentum of diatomic), whereas the exothermic H2+F reaction benefits more from translational energy (i.e. momentum of F towards the diatomic).
[Polanyi, J. C. Concepts in Reaction Dynamics. Acc. Chem. Res. 1972, 5, 161−168.]
All of your answers are thoroughly thought through and presented with in depth understanding of the exercise. Rk2918 (talk) 21:37, 15 May 2019 (BST)

