MRD:dankmemez
Exercise 1: H + H-H System
a) On a potential energy surface diagram, how is the transition state mathematically defined? How can the transition state be identified, and how can it be distinguished from a local minimum of the potential energy surface?
The transition state is defined as the maximum on a minimum energy path. The minimum energy path is defined on the potential energy surface diagram below in Figure 1. as the black line running across the bottom of the potential well.

There is a point on this minimum energy path where there is a local maximum, at the corner, which is the transition state. We have been told it has the special property that:
Where q1 and q2 are diagonal vectors relative to rAB and rBC However, this is also true for local minima of the minimum energy path. In order to distinguish the maximum, i.e. the "saddle" from a minimum, the double derivative must be considered.
- and for the saddle.
Whereas
- and for any other minima.
b) Report your best estimate of the transition state position (rts) and explain your reasoning illustrating it with a “Internuclear Distances vs Time” plot for a relevant trajectory.
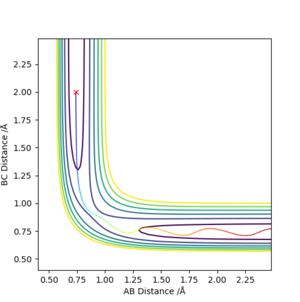
By playing around with different values of AB Distance = BC Distance (if they are not equal, even by a small amount, a trajectory line in one direction is observed) while keeping AB Momentum = BC Momentum = 0, an attempt at estimating the transition state position was made. By first observing from a bird's eye view of the surface plot, an estimate of around 0.9 was chosen for where AB Distance = BC Distance at the transition state. When momentum of each molecule is made = 0, the only distance deviations are from oscillations (i.e. up and down the saddle ridge). The AB/BC distances were changed slightly until there was minimal oscillations on the Internuclear Distance vs. Time graph, indicating the distance at the transition state. This is shown in Figure 2 below:
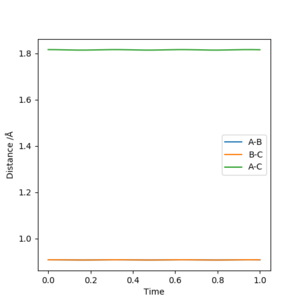
By playing around with it, the optimized distance I found for the transition state was 0.9083 Å.
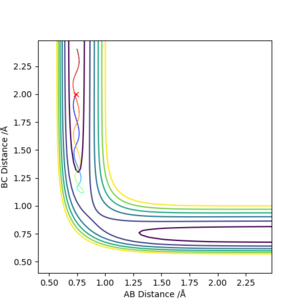
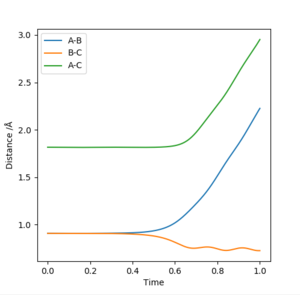
Similarly, if the AB Distance ≠ BC Distance, even by a small amount (0.001 Å), there is a trajectory line plotted (i.e. the A-B and B-C lines start to increase away from the transition state). This is exemplified in Figure 3 below:
c) Comment on how the mep and the trajectory you just calculated differ.
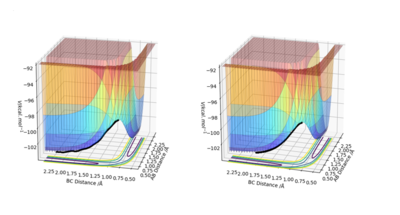
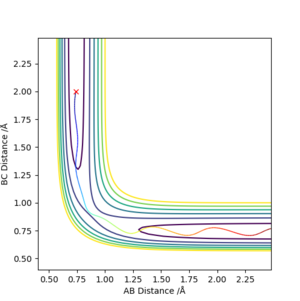
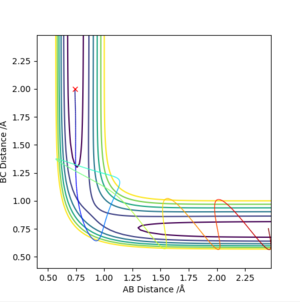
By comparing both plots, it can be seen that the MET plot is straight (i.e. does not have "vibrations") while the dynamic plot is wavy. It can be seen that by plotting rAB=rts-δ and rBC=rts, the molecules then tend to the AB side. This is further exemplified in the Internuclear Distance vs. Time graphs of the same plot below, where we see the A-B length tend to a 0.75-0.77 Å value. We can also see that there is no A-B vibration in the MET plot, as it takes stationary point steps. This can be seen below:
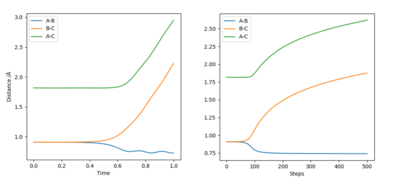
Additionally, we see that the internuclear distance goes further away and is a steeper, more linear graph in the dynamic plot, and probably plateaus out at a much further distance (this can be seen by the black line travelling farther in Figure 4.), while the MET plot has a rectangular-hyperbola-like shape. This can be explained by the fact that the dynamic plot includes the momentum of the particles after the initial repulsion, whereas the MET plot takes a stationary point at each step, thus ignoring any momentum. If it was rAB=rts+δ and rBC=rts instead, the B-C line would tend to the 0.75-0.77 distance while the A-B line would increase away, basically the reaction would go in the opposite direction.
Your obvservations are correct but you need to dig a bit deeper to find an explanation for this difference, between the two calculation methods. Why does the MEP not show vibrations while the Dynamics calculation does?Rk2918 (talk) 10:16, 20 May 2019 (BST)
d) Complete the table above by adding the total energy, whether the trajectory is reactive or unreactive, and provide a plot of the trajectory and a small description for what happens along the trajectory. What can you conclude from the table?
From this table, we can understand that although particles may collide with enough energy to theoretically cross the activation barrier (i.e. pass the transition state), barrier recrossing is possible and the reaction between those two molecules in particular may not happen. When considering this in a typical sample of molecules (which will be distributed in energy/momentum according to the Maxwell-Boltzmann distribution), the effective rate would be lower than theory predicts because some of the collisions with enough energy will not react.
e) State what are the main assumptions of Transition State Theory. Given the results you have obtained, how will Transition State Theory predictions for reaction rate values compare with experimental values?
There are several assumptions made in the Transition State Theory (TST):
- Electronic and nuclear motions are separate, i.e. the Born-Oppenheimer approximation from quantum mechanics
- The reactant molecules are distributed according to the Maxwell-Boltzmann distribution
- Molecular systems that have crossed the transition state in the direction of the products cannot turn around and reform reactants
- In the transition state, motion along the reaction coordinate may be separated from other motions and treated classically as a translation
- Even in the absence of an equilibrium between reactant and product molecules, the transition states that are becoming products are distributed among their states according to the Maxwell-Boltzmann laws.
From the TST, we are trying to predict the rate constant k of a reaction. However, the theoretical prediction may fall short due to some limitations TST has when it comes to predicting rate constants.
- TST assumes that once systems have passed the transition state in the direction of products, it cannot go back. This theory therefore does not take into account barrier recrossing. Barrier recrossing occurs in real systems, and ultimately would result in the predicted rate constant to be greater than the experimental: kpred > kexp
- TST assumes the rate constant to be dependent on a fixed activation energy required for the reaction to proceed. However, it does not take into account the quantum effects, such as tunnelling. In the case of light atoms such as hydrogens, particles lie in energy levels which are higher than the bottom of the potential energy wells, and particles can tunnel through the barrier. These two quantum effects ultimately lower the energy barrier required for the reaction to take place. This would result in the TST predicting a rate constant lower than the experimental, as there are more collisions that happen with enough energy: kpred < kexp. However, in this case, the effects of barrier recrossing must also be considered.
Absolutely great answer and explanation. This is very thorough and logically presented so you are demonstrating your deep understanding of the question. Rk2918 (talk) 10:23, 20 May 2019 (BST)
Exercise 2: F-H-H System
a) By inspecting the potential energy surfaces, classify the F + H2 and H + HF reactions according to their energetics (endothermic or exothermic). How does this relate to the bond strength of the chemical species involved?
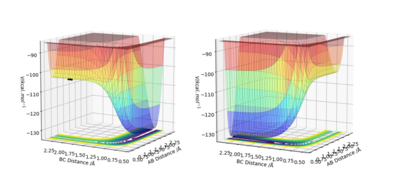
By comparing the two energy surfaces below in Figure 6, we can see that the first reaction F + H2 starts high on the energy surface, and can go to completion if there were any momentum in the molecules, indicating the forward reaction is exothermic and that the H-F bond is stronger than the H-H bond. In comparison, the F-H + H reaction starts on the low energy surface, and would require a lot of momentum between the two molecules to ever cross the barrier of activation and go to the H2 + F side, suggesting that this reaction is endothermic.
b) Locate the approximate position of the transition state.
By increasing "Steps" to 2000, and by changing the BC distance (i.e. H2-F distance) until as little deviation from the point (i.e. the trajectory does not move very far forward or backward) at 0 momentum for both parameters, the following plot was obtained:
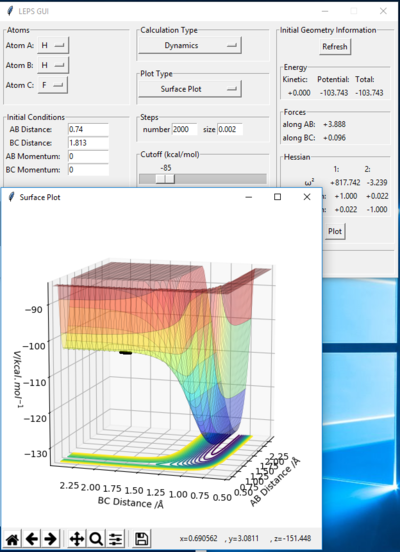
From this, we take rTS(H-H)=0.74 and rTS(H2-F)=1.813
c) Report the activation energy for both reactions
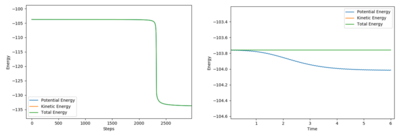
By deviating the BC distance away from the transition state distance, and observing the Energy vs. Time graph shown below in Figure 8, the activation energies are:
- F-H + H reaction = +29.943 kcalmol-1
- H-H + F reaction = +0.250 kcalmol-1
d) In light of the fact that energy is conserved, discuss the mechanism of release of the reaction energy. Explain how this could be confirmed experimentally.
In the example below in Figure 9, the conditions were rH-H=0.74 and rHH-F=1.6 and with all initial momentum=0 (pushing the reaction to the forward side).
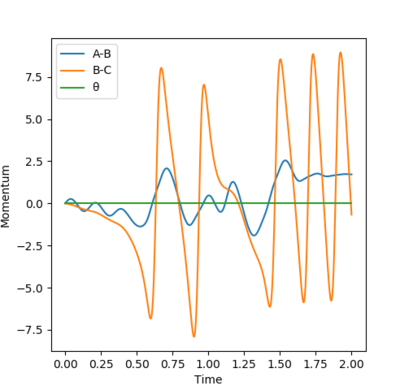
For a dynamic Momentum vs. Time plot and from the animation, it can be seen that the energy that was released from forming the H-F bond goes into a large increase in the B-C oscillation. The A-B momentum tends to a fixed value as they tend towards being far away from each other. It can therefore be inferred that the chemical energy is being converted into kinetic energy, which, on the molecular level, corresponds to an increase in temperature.
e) Discuss how the distribution of energy between different modes (translation and vibration) affect the efficiency of the reaction, and how this is influenced by the position of the transition state.
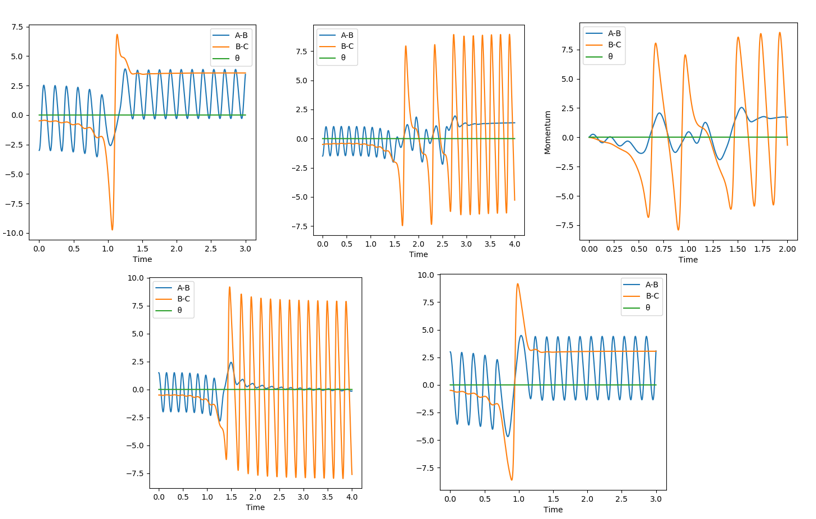
First, the H-H + F reaction (early transition state) was observed. To compare the changing the amount of energy we put into the AB (i.e. H-H) bond, left to right (read like a book) are pAB=-3.0, -1.5, 0, 1.5, 3.0 respectively. At 0, (i.e. the third one) we see a huge increase of B-C oscillation (i.e. H-F vibration) when they come into contact, and then a gradual flattening of A-B, suggesting that the lone H atom has moved far away and has a fixed momentum. By comparing where the A-B atoms have momentum at the end of the interaction, we can determine if the reaction has gone to completion and where the energy has gone. These interactions are explained below in order:
- They bounce but have too much momentum so all the energy stays between H-H vibrations, no chemical reaction.
- They collide and react, with a lot of the potential energy converted into kinetic energy, therefore a high amount of momentum in the H-F bond. H-H tends to a steady momentum indicating the lone H atom moves away.
- They start moving closer, then react, causing oscillation between H-F. H-H tends to a steady momentum indicating the lone H atom moves away.
- They collide and react, and similarly most of the energy goes into the H-F bond oscillation. The lone H atom tends to 0 momentum indicating it is farther away.
- They bounce but have too much momentum so all the energy stays between H-H vibrations, no chemical reaction.
It is clear from this that pAB=-3.0 and 3.0 are very similar in not reacting (i.e. too much energy that they bounce, essentially barrier recrossing (see Figure 13 below), and that pAB=-1.5 and 1.5 are similar in the fact that they react and transfer vibrational energy into the H-F bond.
When the values were changed to pAB=0.1 and pBC=-0.8, effectively lowering the vibration energy in H-H to a reasonable level and increasing the momentum the molecules have towards each other. This results in a much cleaner transfer of energy into the products, as can be seen by the very small window in between clean oscillations in Figure 11 below:
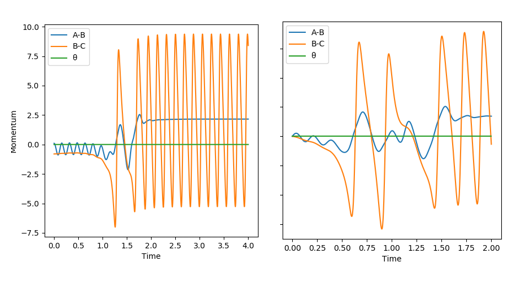
Next, the reverse reaction was looked at: F-H + H in Figure 12 below. For this, the transition state is late, as it is endothermic. For this, A=F, B=H, C=H. The initial parameters tested was one where rAB=0.917, rBC=2.0, pAB=5 and pBC=-0.1 i.e. a high vibration and low translation initial momentum setting. Then, when this showed no reaction, the translational energy was increased to a reasonable value pBC=-5.0 to show a completed reaction where the high vibrational energy was visibly transferred into the H-H bond. The endothermic reaction does not occur at all with low AB (vibrational) energy momentum values.
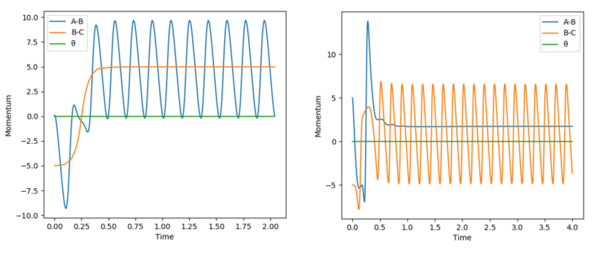
Polanyi's Rules "In a typical chemical reaction with an energetic barrier, there is a saddle point that the reactants must surmount to reach the product side. Which form of energy initially deposited in reactants, translational or vibrational, is more efficacious in surmounting the barrier is one of the central topics in the field of reaction dynamics. In 1972, on the basis of theoretical studies of some model atom–diatom reactions, Polanyi proposed the well-known Polanyi rules, which state that vibrational energy is more efficient in promoting a late-barrier reaction (that is, a transition state resembling the products) than translational energy, whereas the reverse is true for an early barrier reaction" Essentially, for exothermic (early TS), the reaction will occur better (more likely to occur) with more translational and less vibrational energy. Conversely, for endothermic (late TS), the reaction will occur better with much more vibrational energy.
Ok, you have demonstrated that you understand that Polanyi's rules explain your observations. However you should interpret something you have read in the literature and report your research in your own words rather than copying and pasting some text from the literature. Also, this should be referenced. Rk2918 (talk) 10:31, 20 May 2019 (BST)


