
MRD:chl2118
Overall good report. It did start off with answers being not as descriptive as I would have liked, but great improvement seen as the report progressed. There are some errors, but you have discussed your answers in a way to show understanding of the theory you have applied.
EXERCISE 1: H + H2 system
Dynamics from the transition state region
Q: On a potential energy surface diagram, how is the transition state mathematically defined? How can the transition state be identified, and how can it be distinguished from a local minimum of the potential energy surface?
A: The transition state is where the force (the gradient/derivative) is (closest to) zero -- ie where the nuclei are stationary. It can be distinguished from local minima by looking at the second derivative of the function to determine the nature of the stationary point (where the second derivative is positive, the point is a minimum, and if negative, it is a maximum).
How could the TS be identified on a PES? I think you have half the answer or potentially not completely understood. If you have a TS then the second derivative would be positive in one direction and negative in the orthogonal direction. How would the local minimum differ? Mys18 (talk) 22:32, 22 June 2020 (BST)
Trajectories from r1 = r2: locating the transition state
Q: Report your best estimate of the transition state position (rts) and explain your reasoning illustrating it with a “Internuclear Distances vs Time” plot for a relevant trajectory.
A: The rts is estimated to be around 90.8 pm ie where the A-B/B-C curves intersect on a distance vs time plot (and where the 'forces' are closest to zero); this can be seen on the plot below. Additionally, the ω2 values show a positive and a negative value close to zero; this is the saddle point. This value was also tested by starting trajectories near this value, and the trajectory rolled down in one direction or the other from the transition state.

Your estimate is reasonable, but think about why you may not have non linear slopes wrt. r1 and r2/ Mys18 (talk) 22:35, 22 June 2020 (BST)
Calculating the reaction path
The initial conditions were set such that the system was slightly displaced from the transition state and zero initial momenta (i.e. the positions r1 = rts+1 pm, r2 = rts and the momenta p1 = p2 = 0 g.mol-1.pm.fs-1), and the calculation type was changed from dynamics to MEP. The MEP path is shown below and does follow the valley floor to H1+ H2-H3 (aka the reactants):

Trajectories from r1 = rts+δ, r2 = rts
Q: Comment on how the mep and the trajectory you just calculated differ.
A: With MEP, the trajectory only follows across the floor of the valley, with no oscillations ie simply a straight line. On the other hand, the trajectory calculated using the 'Dynamics' calculation type oscillates along the valley floor ie A-B distance fluctuates slightly as it heads towards the product. This suggests that the energy from dissociation of the B-C bond is converted into vibrational energy.

Using the initial conditions r1 = rts and r2 = rts+1 pm instead causes the trajectory (contour plot) to head towards the reactants (rather than the products like above) when starting from (near) the transition state, and the A-B plot switches with the B-C plot on a momenta vs time graph and a distance vs time graph.
(For a r1 = rts and r2 = rts+1 pm plot) Where t is 50 fs, the final values of r1/r2 and p1/p2 are: r1(50) = ~74 pm, r2(50) = ~353 pm, p1(50) = ~3.2, p2(50) = ~5.1. A calculation with these values of r and -p was set up. This calculation gives the reverse of the above reaction, where it starts from a separated atom A and a formed B-C, and the molecules come together to form the transition state.
Your first point could be made with more definition. The dynamic trajectory is slightly more wavy indicating the oscillatory motion of atoms, as you have nicely said such as the vibrational motion of H2 molecule. Would you say MEP or dynamic is more realistic? Mys18 (talk) 22:41, 22 June 2020 (BST)
Reactive and unreactive trajectories
Q: Complete the table [below] by adding the total energy, whether the trajectory is reactive or unreactive, and provide a plot of the trajectory and a small description for what happens along the trajectory. What can you conclude from the table?
| p1/ g.mol-1.pm.fs-1 | p2/ g.mol-1.pm.fs-1 | Etot / kJ mol-1 | Reactive? | Description of the dynamics | Illustration of the trajectory |
|---|---|---|---|---|---|
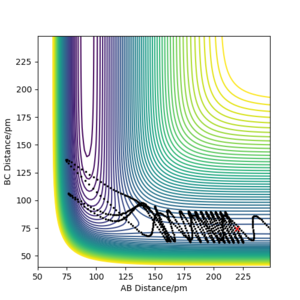
| -2.56 | -5.1 | -414.280 | yes | As A-B distance decreases until rts, the B-C distance doesn't oscillate, suggesting no/low vibrational energy. After the transition state, the B-C distance increases and the A-B distance remains fairly constant on average, with small oscillations suggesting A-B has vibrational energy. |  |
| -3.1 | -4.1 | -420.077 | no | Initially, A-B distance decreases until around 110 pm (with B-C remaining constant on average with oscillations ie B-C has vibrational energy). However, at this point the A-B distance stats to increase again. This suggests that this trajectory does not have sufficient kinetic energy to overcome the energy barrier (and form the transition state), thus the trajectory is unreactive. |  |
| -3.1 | -5.1 | -413.977 | yes | Again, A-B distance decreases until rts while the B-C distance oscillates only slightly (suggesting low vibrational energy). After the transition state, the B-C distance increases and the A-B distance remains fairly constant on average, with larger oscillations than B-C, suggesting A-B has (higher) vibrational energy. |  |
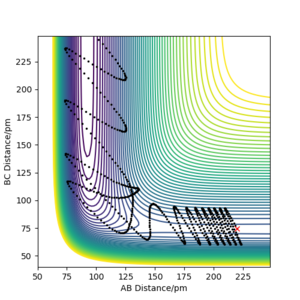
| -5.1 | -10.1 | -357.277 | yes | Initially, A-B distance decreases (without B-C oscillations) until the rts, where the B-C distance starts to increase, with very large oscillations in the A-B distance. However, soon after this, the B-C distance starts to decrease and the A-B distance once again starts to increase, again wih very large oscillations (this time in the B-C distance). This suggests that soon after the A-B complex forms, A & B again separate and B-C forms again ie barrier recrossing. |   |
| -5.1 | -10.6 | -349.477 | yes | Again, initially the A-B distance decreases (without B-C oscillations) until the rts, where the B-C distance starts to increase -- however, the A-B distance very quickly increases again (and B-C distance decreases), before resuming the B-C increase (with a small average A-B distance and very large oscillations. This suggests that soon after the A-B complex forms, A & B again separate and B-C forms again, but then once again B and C separate and A-B reforms. |   |
From this table it can be concluded that the proposed hypothesis is largely correct ie all trajectories starting with the same positions but with higher values of momenta (higher kinetic energy) are reactive as there is enough kinetic energy to overcome the activation barrier -- however, p1 can be slightly lower than 3.1 if p2 is sufficiently high. Additionally, it can be concluded that the activation barrier is between -414.280 and -420.077 kJ mol-1.
You conclusions match your answered reactive trajectories. But, I would have thought row 4 is not reactive; you can see evidence for barrier recrossing where you have products reverting back to reactants.. Mys18 (talk) 22:44, 22 June 2020 (BST)
Transition State Theory
Q: Given the results you have obtained, how will Transition State Theory predictions for reaction rate values compare with experimental values?
A: Given two of the assumptions of Transition State Theory:[1]
- Reactants with sufficient energy to cross the activation barrier (and form the transition state) to form the products will not re-cross the barrier to re-form the reactants.
- All motion is considered classically as a translation ie ignore aspects such as quantum tunnelling.
From the first assumption only, TST predicts a higher reaction rate than experimental as it assumes all reactants (with sufficient energy) would become products, whereas in reality, this may not be the case. However, the second assumption, by ignoring quantum tunnelling, predicts a lower reaction rate than experimental values. (Note there is a third assumption, where TST predicts that not all reactant will become TS (and thus the product), and that the amount of reactant determines the amount of activated complex TS. Reactants and products do not have to be in equilibrium.)
Overall, the TST overestimates reaction rates slightly.[1]
Given our results in the table above, it can be seen that the programme does not also follow both of these assumptions. While quantum tunnelling indeed does not occur, it's clear that barrier re-crossing is possible, and sometimes happens multiple times. As a result, this programme more than likely underestimates reaction rate values.
Great discussion and reference :)! Mys18 (talk) 22:47, 22 June 2020 (BST)
EXERCISE 2: F - H - H system
PES inspection
Q: By inspecting the potential energy surfaces, classify the F + H2 and H + HF reactions according to their energetics (endothermic or exothermic). How does this relate to the bond strength of the chemical species involved?
A: For F + H2 -- the potential energy surface drops when the B-C distance increases ie when the product F-H forms (the surface contains an early-downhill surface); see below.[2] This suggests it is an exothermic reaction. For H + HF, which is just the reverse of the previous reaction, the reaction appears to be endothermic, as the PES goes up in energy for the products.

In terms of relating to the bond strength: in an exothermic reaction (F + H2), the product (H-F) state is lower in energy (more stable) than the reactant (H-H), whereas in an endothermic reaction (H + HF), the reactant (H-F) state is lower in energy than the product (H-H). Both cases thus suggest that the H-F bond is stronger than the H-H bond, as H-F is lower in energy/more stable.
Great! You could even search for experimental H-F and H-H bond values to further support your finding. Mys18 (talk) 22:48, 22 June 2020 (BST)
Q: Locate the approximate position of the transition state.
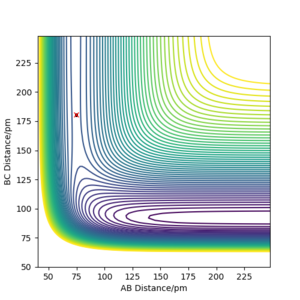
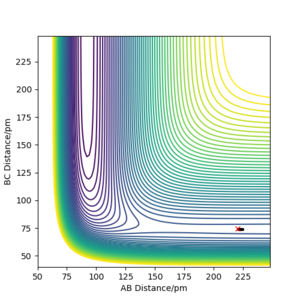
A: Given Hammond's postulate, the TS will be closer to the reactants in F + H2 (where there is an early transition state), and closer to the products in H + HF (where there is an late transition state). For F + H2, the transition state was determined to be r1 = 74.5 pm, r2 = 180.6 pm (where r1 is distance between reactant atoms B and C). For H + HF, the transition state was determined to the reversed coordinates: r1 = 180.6 pm, r2 = 74.5 pm.
-

Transition state position of F + H2 reaction -
Transition state position of H + HF reaction


Q: Report the activation energy for both reactions.
(You will be able to report a reasonable estimate by performing a mep (with a sufficient number of steps) from a structure neighbouring the transition state, and choosing to plot the appropriate quantity as a function of "time".)
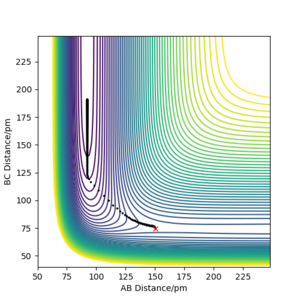
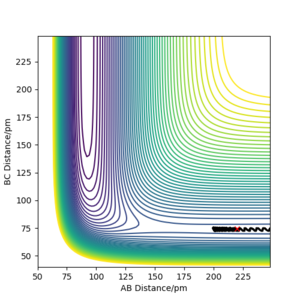
A: The energies of the reactants/TS were found using MEP and the programme's given Energy values. The plots created are shown below (the determination of the reactant energy of H + HF was still completed on a F + H2 plot using 'Get Last Geometry' to find the reverse reaction energy). Additionally, the Energy vs Time plots have been included, and the change between the transition state (initial y value) to the reactants (final y value) can be seen -- given that the activation barrier for F + H2 is so small, the beginning region has been zoomed in on. These plots give a more quantitative view of the activation energy for each reaction.
The energies were found to be as follows:
ETS = -433.981 kJ mol-1
(F + H2) Ereactant = -434.478 kJ mol-1
(H + HF) Ereactant = -558.955.140 kJ mol-1
This thus gives E0 of F + H2 = +0.497 kJ mol-1, and E0 of H + HF = 124.974 kJ mol-1.
-
Contour plot of mep with a structure neighbouring TS of F + H2 reaction -
Contour plot of mep with a structure neighbouring TS of H + HF reaction


-

Energy vs time plot of F + H2 reaction (full view) -

Energy vs time plot of F + H2 reaction (zoomed in view) -

Energy vs time plot of H + HF reaction


Reaction Dynamics
F + H2
Initial conditions that resulted in a reactive trajectory for F + H2 are as follows: r1 (H-H distance) = 70 pm, r2 = 190 pm, p1 = -4 g.mol-1.pm.fs-1, p2 = -4 g.mol-1.pm.fs-1. This resulted in the (contour) plot below, which shows a reactive trajectory with no barrier re-crossing. Additionally, the momenta vs time plot is shown, showing how, as the B-C (H-H) bond broke, the momentum decreased greatly, whereas the A-B (F-H) momentum increased hugely.


Q: In light of the fact that energy is conserved, discuss the mechanism of release of the reaction energy. Explain how this could be confirmed experimentally.
A: Energy is released into the vibrational mode of the product molecule (H-F). The potential energy that the molecule had has become vibrational kinetic energy in the products channel after dorpping down from the reactant channel/transition state. Additionally the F + H2 reaction involves something called 'mixed energy release'. This is where the energy from B-C (H-H) dissociating causes the formed product, A-B (H-F), to vibrate substantially.[2]. (Note that for early TS exothermic reactions such as this one, translational energy is the most effective for crossing the activation energy barrier.[2])
This could be confirmed via IR. When the H-F bond forms, for the above reasons, the H-F molecule becomes excited. This results in overtones and a second peak in the IR (originally, only one peak in the IR spectrum would have been present). This second peak is smaller and to the left of the initial peak. As the molecule reverts back to the relaxed state the overtone becomes smaller and the original peak becomes larger.
Additionally, there may be emission from the excited state to the relaxed state ie a vibronic transition. Thus the mechanism of release of reaction energy could also be confirmed using Raman spectroscopy.
Nice! you could look up 'chemiluminescence' which may be useful in monitoring the emission of infrared radiation from the sample. Mys18 (talk) 22:52, 22 June 2020 (BST)
A calculation starting on the reactant side with pFH = -1.0 g.mol-4.pm.fs-1 and pHH = -6.1 to 6.1 g.mol-4.pm.fs-1 was set up using r<subHH = 74.5 and rFH = 220. The further from 0 (ie -> ±6.1), the greater the vibrational energy/kinetic energy as a result of momentum increasing. Additionally, the number of barrier recrossings tends to increase as the magnitude of the momentum increases.
At values close to 0, there isn't enough kinetic energy to cross the activation barrier at all; instead, after a certain time/number of steps, the H-H molecule begins to move away from the F atom. Additionally, the positive momenta seemed to have larger vibrational energy.
These observations can be seen in the plots below.
-
pHH = -1.0 -

pHH = 1.0


-
pHH = -6.0 -
pHH = 6.0


For the same initial position, the FH momentum was increased slightly to pFH = -1.6 g.mol-4.pm.fs-1 and the overall energy of the system was reduced by reducing the momentum to pHH = 0.2 g.mol-1.pm.fs-1. Here, (with sufficient number of steps) the system starts off with very small oscillations (vibrational energy), and after crossing the activation barrier (several times), the product is produced with much larger oscillations, suggesting that the vibrational energy became very large (and the translation energy became small). See below:

H + HF
Initial conditions starting at the bottom of the entry channel, with very low vibrational motion on on the H - F bond and an arbitrarily high value of pHH above the activation energy (an H atom colliding with a high kinetic energy) were set up. Where the pHH value > activation energy, a barrier re-crossing (often) occurs.

Using the inversion of momentum procedure, a reactive trajectory with the following distances and momenta were found: r1 (H-F distance) = 90.5 pm, r2 = 165.4 pm, p1 = 15.1 g.mol-1.pm.fs-1, p2 = -0.9 g.mol-1.pm.fs-1. As you can see, the momentum of the incoming H atom was decreased, and the energy of the H-F vibration was increased. This is shown in the plot below.

Q: The cases studied are an illustration of Polanyi's empirical rules. Discuss how the distribution of energy between different modes (translation and vibration) affect the efficiency of the reaction, and how this is influenced by the position of the transition state.
A: According to Polanyi, whether the reaction involves a late or early transition state is vital to finding the energy distribution in the product.[3] Vibrational energy is more effective/useful for crossing the activation barrier for endothermic reactions (such as H + HF) as the activation barrier is much higher in energy, whereas translational energy is more effective/useful for exothermic.[2][3]. For late barriers/transition states, translational energy alone isn't enough to surmount the high barrier while 'changing direction' -- the molecule would simply 'bounce off' the sides of the surface -- since the TS/activation barrier is late, the atom must first change direction before overcoming the barrier, thus vibrational energy is important. More vibrational energy allows the molecule to change directions more easily (to align with product direction) while having enough energy to surmount the barrier. This is why large amounts of vibrational energy is needed. For early barriers/TSs, the TS comes before the change in direction, thus translational energy is more important ie the direction should remain the same in order to efficiently cross the activation barrier. This results in the observations above.
For an exothermic, early transition state, as TS occurs quickly, the energy in the reaction is released before the A-B (product) bond is fully formed. As a result, the energy primarily contributes to vibrational motion (of the products).[3] On the other hand, for a late (endothermic) transition state, the energy is released after product bond formation, while the B-C bond is fully dissociating, resulting in increased translational motion of the products (A-B and C).[3] There is the suggestion that translational energy is transformed into vibrational energy for exothermic reactions, and vice versa for endothermic.
The above ideas from literature are supported by the findings of this lab. In H + HF plot above, where the reaction is endothermic (late TS), you can see quite clearly that the vibrational energy is much greater in the reactants than in the products (oscillations decrease after transition state). Other cases, where the vibrational energy was small in the reactants, are not able to overcome the energy barrier (see example below). The F + H2 plot from earlier in the section also shows this idea (although it's the reverse for this reaction, as it is an exothermic reaction with an early TS). This supports the idea that vibrational energy is more effective/useful for crossing the activation barrier for endothermic reactions (such as H + HF), whereas translational energy is more effective/useful for exothermic.
This is a great discussion showing evidence for understanding Polanyi's rule. Mys18 (talk) 22:56, 22 June 2020 (BST)

References
[1] J. I. Steinfeld, J. S. Francisco, W. L. Hase, in Chemical Kinetics and Dynamics, Prentice-Hall, Upper Saddle River, 2nd ed., 1998, ch. 10, pp. 287-318
[2] K. J. Laidler, in Chemical Kinetics, Harper & Row, New York, 1987, 3rd ed., ch. 12, pp. 460-471
[3] J. I. Steinfeld, J. S. Francisco, W. L. Hase, in Chemical Kinetics and Dynamics, Prentice-Hall, Upper Saddle River, 2nd ed., 1998, ch. 9, pp. 272-274