MRD:chl1718 04052020
Modelling Molecular Reaction Dynamics
H-H-H
Plots using the lepsgui.py function
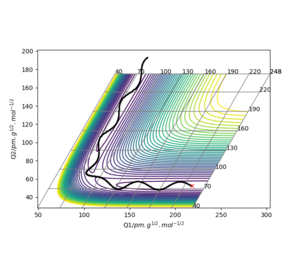
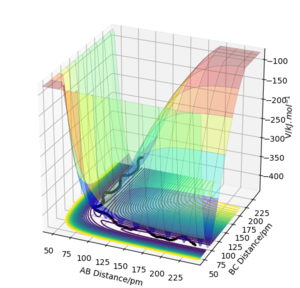
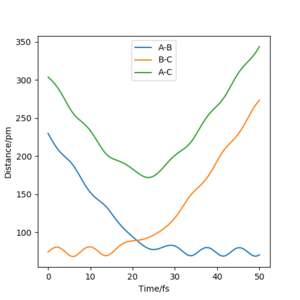
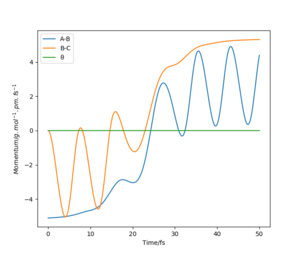
These are the various results that the program is able to show, given inputs rAB = 230 pm, rBC = 74 pm, pAB = -5.2 g mol-1 pm fs-1, pBC = 0 g mol-1 pm fs-1, for the reaction HA + HBHC → HAHB + HC.

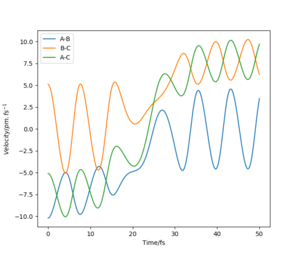
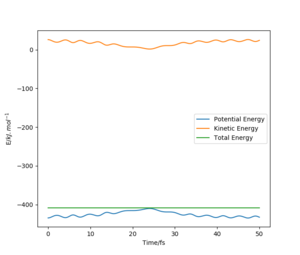
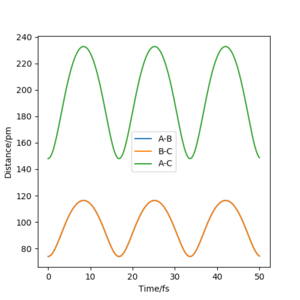
Transition State
On a potential energy surface diagram, how is the transition state mathematically defined? How can the transition state be identified, and how can it be distinguished from a local minimum of the potential energy surface?
The transition state is defined as , and , where U is the potential, is the curve of the reaction pathway of minimum energy, and is the line perpendicular to it. In other words, a saddle point. The transition state can be located by first looking at points where the gradient equals 0, then checking if the second derivative is negative in one direction and positive in the direction orthogonal to it.[1]
Ok, it would be good to include an image of the saddle point Rs6817 (talk) 14:50, 19 May 2020 (BST)
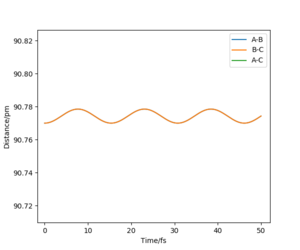
Report your best estimate of the transition state position (rts) and explain your reasoning illustrating it with a “Internuclear Distances vs Time” plot for a relevant trajectory.
For the reaction H + H2 → H2 + H, the transition state position was determined to be rts = (90.774249787545475, 90.774249787545475). Because of the symmetry of the reaction (the forwards reaction is the same as the backwards reaction), the potential surface is also symmetrical. It is a reflection in the x-y plane. Therefore, rAB = rBC, and rts = (r, r). For the transition state position, because , the molecule will be completely stationary if the initial momenta are both set to 0 g mol-1 pm fs-1, while other points will undergo a symmetric vibration. By looking at the Internuclear Distances vs Time graph and using an iterative method, the vibration was minimised until they could not be seen even by magnifying the scale.
Ok, good degree of accuracy in reporting the value however some units would be good here Rs6817 (talk) 14:50, 19 May 2020 (BST)

MEP
Comment on how the mep and the trajectory you just calculated differ.
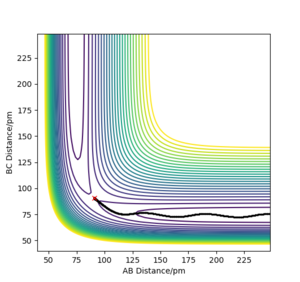
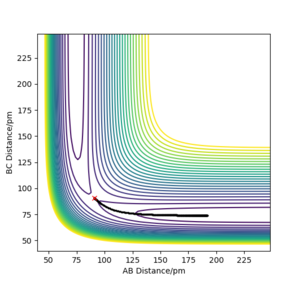
Using rAB = 91 pm and rBC = rts, the mep follows the path of the maximum gradient. There are no vibrations like in the dynamics trajectory, where the conserved energy turns into vibrational energy, causing the trajectory to oscillate. The "speed" is also much slower for the mep, with rAB changing much less than the dynamics trajectory in the same amount of time steps, because the momenta are reset to 0 in each step.
This explanation is fine, although some more detail is required I think, what are the oscillations proportional to? How does velocity relate to mass? Rs6817 (talk) 14:53, 19 May 2020 (BST)
Reaction Table
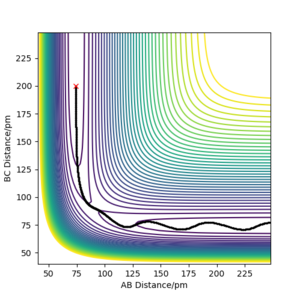
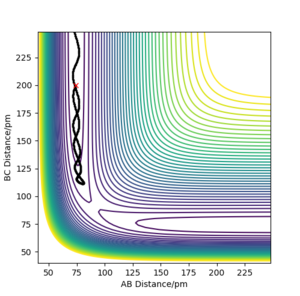
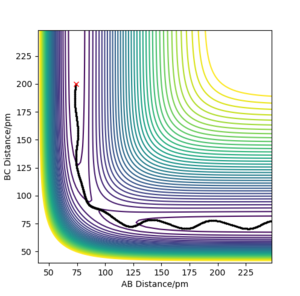
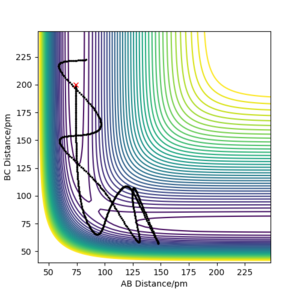
Complete the table above by adding the total energy, whether the trajectory is reactive or unreactive, and provide a plot of the trajectory and a small description for what happens along the trajectory. What can you conclude from the table?
It can be concluded that a minimum amount of energy is needed for a reaction to happen, but at high enough energies, the proportions of the reactants' momenta must also be correct in order to have a successful reaction.
Good description in the table, however if you refer to 'reaction 1' include another column denoting each reaction numerically. In your conclusion, what is the type of energy required? Does vibrational energy cause barrier recrossing? Rs6817 (talk) 14:59, 19 May 2020 (BST)
Transition State Theory
Given the results you have obtained, how will Transition State Theory predictions for reaction rate values compare with experimental values?
TST predicts that all reactions that have more energy than the activation energy are successful. However, as some reactions recross the barrier and reform the products, TST theory overestimates the reaction rate compared to real values.
More detail was required for this question, I suggest recapping the assumptions of TST. i.e. Quantum tunnelling considerations, Boltzmann distributions of reactant in quasi equilibrium with the concentration of transition state etc. Yo are correc that TST tends to overestimate, how does this relate to the simulations you performed above? What does this say about barrier recrossing? Rs6817 (talk) 15:02, 19 May 2020 (BST)
F-H-H
Potential Surface
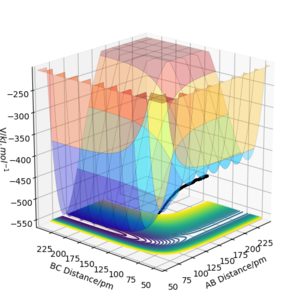
By inspecting the potential energy surfaces, classify the F + H2 and H + HF reactions according to their energetics (endothermic or exothermic). How does this relate to the bond strength of the chemical species involved?
As can be seen from the surface plot, F + H2 is exothermic (reactants higher in energy than products), and H + HF is endothermic (reactants lower in energy than products). This is because HF has a much higher bond strength than H2, so forming an HF bond releases more heat than breaking an H2 bond and vice versa.
It is unclear from this plot what the incoming atom is, i.e. F-H + H or F + H-H? Your description is otherwise correct however, so well done. Perhaps a comparison of literature bond energies would have helped to make your point here? Rs6817 (talk) 15:06, 19 May 2020 (BST)
Locate the approximate position of the transition state.
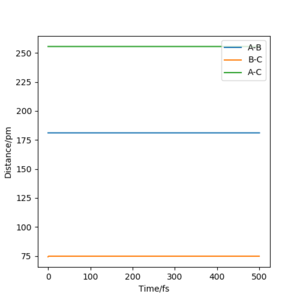
The Hammond postulate gives us that points of similar energy in a reaction pathway are also similar in structure. Considering F + H2, an exothermic reaction with an extremely small activation energy, the transition state must look very similar to the reactants, with the H atoms close together. By calculating mep trajectories, inspecting the internuclear distance vs time graphs, and trial and error on the flat region around rHH = 74, the transition state position was estimated to be rts = (rHH, fHF) = (74.48722437, 181.11017411).
Good estimations of the values, please keep decimal places consistent. What are the forces along each bond at the trnasition state? Rs6817 (talk) 15:08, 19 May 2020 (BST)
Report the activation energy for both reactions.
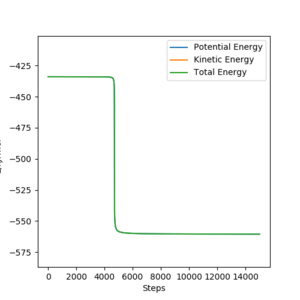
F +H2
EA = 434 - 560.5 = 126.5 kJmol-1
H + HF
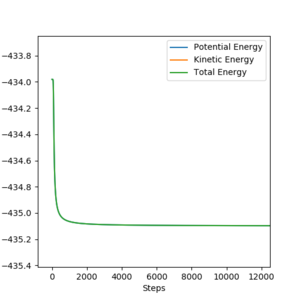
EA = 435.09 - 433.98 = 1.11 kJmol-1
Again great, but some more detail on the initial conditions would help here, nice use of plots though well done. Rs6817 (talk) 15:10, 19 May 2020 (BST)
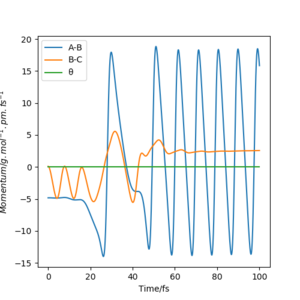
In light of the fact that energy is conserved, discuss the mechanism of release of the reaction energy. Explain how this could be confirmed experimentally.
The Momentum vs Time graph shows that the energy mostly gets turned into vibrational energy. This is released as heat, which can be measured by calorimetry.
Ok, what type of calorimetry and why would this be an appropriate technique? Bomb calorimetry would be ideal for detecting the change in temperature of a medium absorbing released vibrational energy Rs6817 (talk) 15:12, 19 May 2020 (BST)
Discuss how the distribution of energy between different modes (translation and vibration) affect the efficiency of the reaction, and how this is influenced by the position of the transition state.
H + HF
| pFH/ g.mol-1.pm.fs-1 | pHH/ g.mol-1.pm.fs-1 | Reactive? | Illustration |
|---|---|---|---|
| 13.75 | -2.38 | Y | 
|
| -1 | -7 | N | 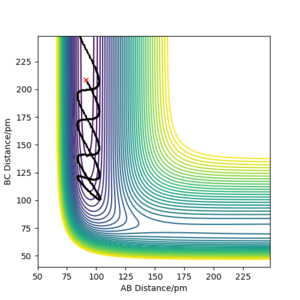
|
The F-H-H surface is a late-barrier endothermic surface. From Polanyi's empirical rules, therefore vibrational energy is more conducive to a successful reaction, as can be seen in the above table. When the H atom has a large amount of translational energy and there is little vibrational energy in HF, the H atom is bounced back by the barrier wall. If the surface was an early barrier type, and hence if the transition state was closer to the reactant side in H + HF, then the opposite would have been the case and translational energy would have been more effective for a successful reaction, because the transition state can be reached just by the H atom getting closer to the HF molecule. Here, a large separation between H and F is needed before the transition state can be crossed.[2]
Did you only try two initial conditions? Good discussion of Polanyi rules here well done. I think you could have shown even ebtter understanding by illustrating this with examples from the software. Rs6817 (talk) 15:18, 19 May 2020 (BST)
References
Some more references may have supplied the detail required Rs6817 (talk) 15:14, 19 May 2020 (BST)

