MRD:ch6518
Molecular Reaction Dymanics
Exercise 1: H + H2 system
- On a potential energy surface diagram, how is the transition state mathematically defined? How can the transition state be identified, and how can it be distinguished from a local minimum of the potential energy surface? The transition state appears on potential energy surfaces as a saddle point—it is a critical point (derivatives are zero) but it is neither a local minimum nor a local maximum. Unlike a local minimum, at which an infinitesimal perturbation in any direction will result in a positive derivative, or a local maximum at which perturbation will result in a negative derivative, perturbation from a saddle point will result in a derivative whose sign depends on the direction of the perturbation. OK. Mak214 (talk) 14:11, 24 May 2020 (BST)
Please carefully read the part where you argue with infinitesimal perturbation again, and think of a simple parabola in one dimension. At the (one) minimum, i.e. zero for x², perturbation in negative (positive) direction leads to a negative (positive) derivative, but it is a minimum... Fdp18 (talk) 18:00, 24 May 2020 (BST)
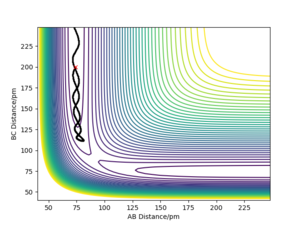
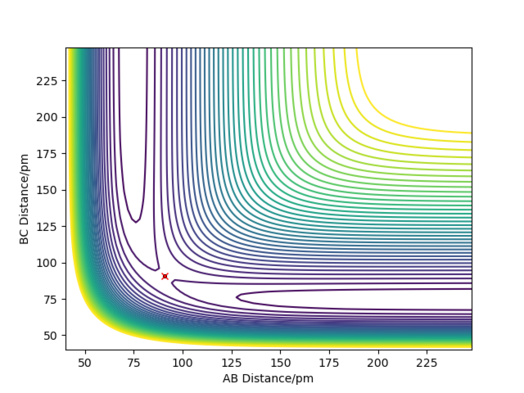
- Report your best estimate of the transition state position (rts) and explain your reasoning illustrating it with a “Internuclear Distances vs Time” plot for a relevant trajectory. The transition state in a H+H2 system has a position rts = 90.75 ± 0.05 pm This was determined by approximating the position of the transition state by visual inspection of the contour plot for internuclear distances—this was estimated as 91 pm—then modifying the initial conditions around this approximation in a binary search-type method until the amplitude of oscillations in the “Internuclear Distances vs Time” plot were as close to zero as possible. Great! well done.Mak214 (talk) 14:12, 24 May 2020 (BST)

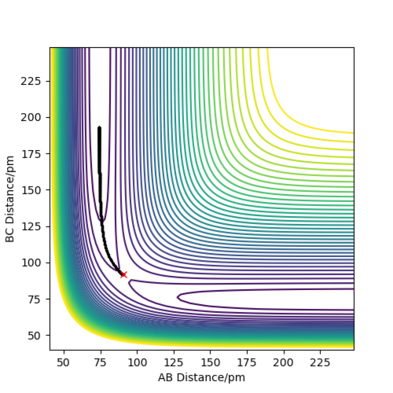
- Comment on how the mep and the trajectory you just calculated differ. The MEP (minimum energy path) of the reaction is simply the route that is parallel to and in the opposite direction of of the gradient vector (orthogonal to the contour) at every point; that is to say, it moves towards and then follows the trough/valley of the energy surface—the bond length in the product molecule will decrease to a constant. This shows the energy profile of a reaction clearly, but it fails to take into account the vibrational energy in molecules. In reality, as shown by the dynamics plot of the same reaction, there is vibrational energy in the system, so the interatomic distance between the two atoms in the product molecule will oscillate. As a result, the kinetic energy of the system will have the same total value as in the mep plot, but it will be comprised of both translational and vibrational kinetic energy. Good. this is because we reset momenta to 0 at every timestep for MEP type calculations whereas dynamics calculations the particles may have residual momenta and can therefore climb back up an energy barrier - so we see bond vibration... Mak214 (talk) 14:11, 24 May 2020 (BST)
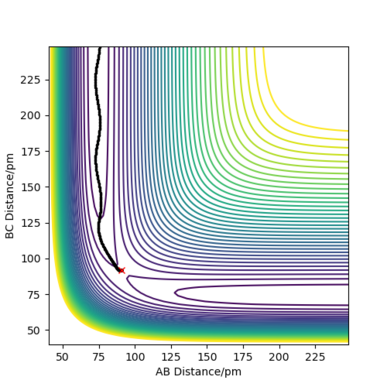
- Complete the table by adding the total energy, whether the trajectory is reactive or unreactive, and provide a plot of the trajectory and a small description for what happens along the trajectory. What can you conclude from the table? POTENTIAL ENERGY OF TRANSITION STATE = -415.378 kJ.mol-1
From this table, it is evident that total energy alone is insufficient to determine whether the system will cross the transition state or not. It appears that increasing translational energy increases the likelihood of successful reaction up to a certain point, after which it makes the system more likely to cross back over the transition state. Conversely, increasing vibrational energy appears to make the system less likely to cross the transition state. A combination of these two factors will therefore determine if the trajectory is reactive or not. Good! Mak214 (talk) 14:11, 24 May 2020 (BST)
- Given the results you have obtained, how will Transition State Theory predictions for reaction rate values compare with experimental values? Transition state theory assumes that all trajectories are reactive if they have total kinetic energies greater than the activation energies of the reaction. However, the fourth entry in the table demonstrates that this is not always the case; though the kinetic energy of the system was significantly higher than the activation energy required, the trajectory was overall unreactive. As a result, for this case Transition State Theory will predict a rate for a reaction that in reality does not happen. Yes, although some more discussion is needed here including reference to the main postulates of transition state theory. We say that every system which overcomes the activation energy barrier and crosses into the transition state WILL go to form the products - which we see is not the case in trajectory 4 in your table above. This means that the rate predicted by TST is overall too high. There are also quantum tunnelling effects which are overlooked by TST although we do not model for these in this experiment, these will result in an underestimate in the rate of a reaction predicted by TST. Overall the effect of tunnelling is small so TST overestimate reaction rates. Mak214 (talk) 14:11, 24 May 2020 (BST)
Exercise 2: F - H - H system
- By inspecting the potential energy surfaces, classify the F + H2 and H + HF reactions according to their energetics (endothermic or exothermic). How does this relate to the bond strength of the chemical species involved? The F + H2 → H + HF reaction is exothermic, therefore the H + HF → F + H2 reaction is endothermic.This is because the H-F bond is much stronger than the H-H bond, therefore less work is done on the H-H bond to break it than the amount of work done on the surroundings by the formation of the H-F bond. This results in an exothermic reaction. Conversely, more work must be done to break the H-F bond than is done by forming a H-H bond, so this reaction is endothermic. Yes you are correct - but the question asks to demonstrate this using the potential energy surfaces. How can you see in the surface plot figure for example that these reactions are exo/endo-thermic? When you see the energy of the reactant channel and compare it to the energy of the product channel this becomes clear. Personally, I think the figure below shows this less clearly than the surface plot does. Mak214 (talk) 14:15, 24 May 2020 (BST)

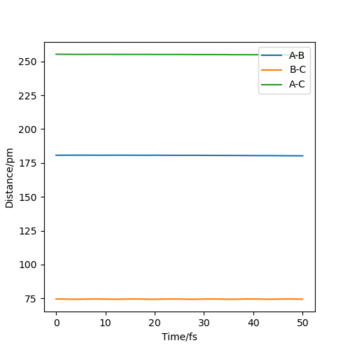
- Locate the approximate position of the transition state. The transition state for the F-H-H system is at rF-H = 180.71 pm, rH-H = 74.6 pm. This was determined using the same method as for the H-H-H system. Well done.Mak214 (talk) 14:15, 24 May 2020 (BST)
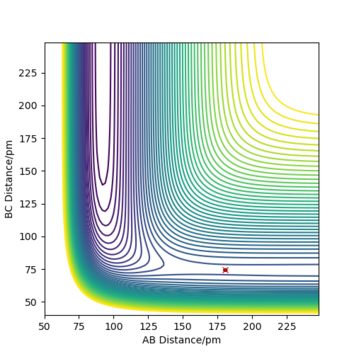
- Report the activation energy for both reactions. The transition state has a potential energy of -433.979 kJ.mol-1. As H-H are further separated from F along the minimum energy path, the potential energy of the system tends to -435.039 kJ.mol-1. Consequently, the activation energy for the F + H2 → H + HF reaction must be +1.060 kJ.mol-1. For a system in which the H-F product has formed and is separate from the H, the energy along the MEP tends to -560.700 kJ.mol-1. Thus, the activation energy for the H + HF → F + H2 reaction is +126.721 kJ.mol-1. We can therefore see the enormous 120x difference in activation energy for the reaction in each direction Good. It would be nice to have some diagrams to illustrate this here - or at least the positions of your pure reactant states for each calculation so we can see where you got these energy values from. Mak214 (talk) 14:15, 24 May 2020 (BST)
- In light of the fact that energy is conserved, discuss the mechanism of release of the reaction energy. Explain how this could be confirmed experimentally. At any point in time, kinetic energy + potential energy = constant. Therefore, when reaction (potential) energy is released, it is converted to kinetic energy, which comprises both vibrational and translational modes. The internuclear velocity profile of an exothermic reaction such as the formation of HF and H from H2 and F shows a large increase in the velocity and oscillation amplitude of the products compared to the atoms. This demonstrates the conversion of chemical potential energy into translation and vibration, Experimentally, this could of course be determined by simple calorimetry; the temperature of a substance is related by the Boltzmann distribution to the population of its kinetic energy states, so the increase in temperature for an exothermic reaction can be attributed to this release of reaction energy. Yes but how can we determine how much translational and vibrational energy is released - calorimetry will not distinguish between these, what method would therefore be more useful?? Mak214 (talk) 14:24, 24 May 2020 (BST)
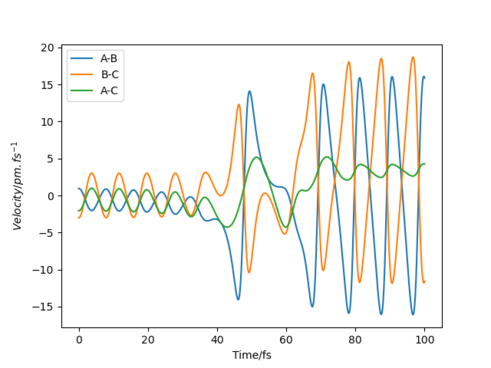
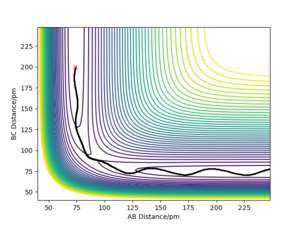
- Discuss how the distribution of energy between different modes (translation and vibration) affect the efficiency of the reaction, and how this is influenced by the position of the transition state. The success of a reaction seemed to be determined by how closely the trajectory of the components followed the minimum energy path—systems which deviated from this path were more likely to re-cross the transition state and form the reactants again. In the symmetric H+H2→H2+H reaction, the most efficient distribution was for all energy to be in the translational mode, since this allowed the system to follow the MEP closely. In the F + H2 → H + HF reaction, where the transition state was very close to the reactants, low-ampliude oscillation resulted in the most reactive trajectories, specifically oscillations in which the atoms in the reactant molecule were separating as the transition state was crossed. This suggests that low-amplitude, high-frequency oscillations are optimum as they keep the reaction path close to the minimum energy path, whilst increasing the chance that the momentum will be in the correct direction for any given point. Conversely, in the H + HF → F + H2 reaction, in which the transition state was very similar to the products and far from the reactants, higher-amplitude oscillations seemed to be favoured for much the same reason- they ensured the reaction closely followed the MEP. It may therefore be said that for a trajectory to be efficient, more energy must be distributed to the vibrational modes the further the transition state is from the reactants.
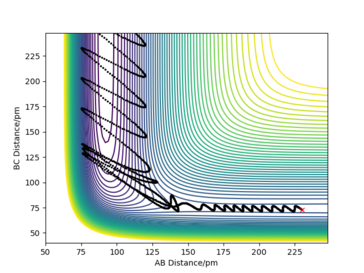
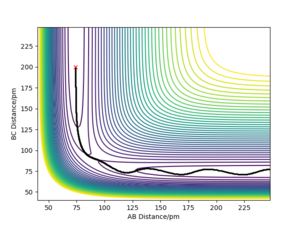
An example of an exothermic trajectory in which there is little energy in the vibrational modes of the system prior to crossing the transition state- the reaction plot passes over the transition state at the same point as the MEP 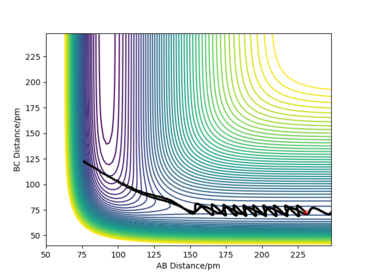
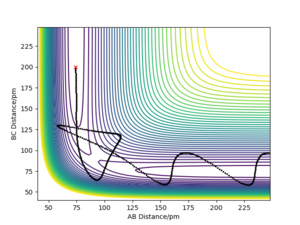
An example of an exothermic reaction with greater amplitude of oscillation and thus greater deviation from the MEP when crossing the transition state- this trajectory re-crosses the transition state.
What is here is well written, well done. You should do some further reading on polanyi's rules to really get the most out of this exercise. Remember whenever you write a report to include references to literature you have read or some results of your own to back up all your statements. Mak214 (talk) 14:28, 24 May 2020 (BST)

