MRD:celiab
EXERCISE 1: H + H2
The Transition State
On a potential energy surface diagram, how is the transition state mathematically defined? How can the transition state be identified, and how can it be distinguished from a local minimum of the potential energy surface?
- On PES diagrams, transition states are mathematically defined as points with 0 gradient with respect to position: stationary points.
- The transition state corresponds to the saddle point; the highest energy point on the reaction coordinate, which is the lowest energy pathway.
- We can distinguish it from a local minimum because on the reaction coordinate axis, the saddle point representing the transition state, will be a local maximum, but on the orthogonal axis it will be a local minimum. The minima are minimums on either direction because they represent stable reactants and products. All correct, could also explain maxima and minima mathematically with reference to second derivatives. Pu12 (talk) 20:41, 21 May 2020 (BST)
H + H2 reaction

Locating the Transition State
Report your best estimate of the transition state position (rts) and explain your reasoning illustrating it with a “Internuclear Distances vs Time” plot for a relevant trajectory.
- The reaction is symmetric, hence, the transition state must have r1 = r2 by Hammond's Postulate
- By testing different initial conditions where rAB=rBC and p1 = p2 = 0 g.mol-1.pm.fs-1, we can find the position of the Transition State
- The position of the transition state was found to be rts=90.775 pm
- This is where the system underwent small periodic symmetric vibrations keeping the distance between the atoms almost constant
- In the plot to the right, we see two straight lines, representing almost a stationary behaviour; thus we know we are at the symmetric transition state.
Calculating the Reaction Path
Comment on how the mep and the trajectory you just calculated differ.
- The minimum energy path is calculated from a system slightly displaced from the Transition state (r1 = rts+1 pm, r2 = rts) and 0 initial momenta and follows the lowest energy path on a PES.
- As the reaction is symmetric it doesn't matter which atoms we label as A B C, so if we used the initial conditions r1 = rts and r2 = rts+1 pm instead, we get the same results but switched: AB will become BC and viceversa.
- The dynamic trajectory includes the momentum of the particles which causes oscillations about the trajectory path.
- The mep trajectory is roughly the same but it's smooth and doesn't oscillate, as the velocities are set to 0 in every step. This means we are artificially removing any gain in vibrational energy which results in oscillations. As the velocity is set 0 at every step, the kinetic energy is also 0. Good. Pu12 (talk) 20:41, 21 May 2020 (BST)
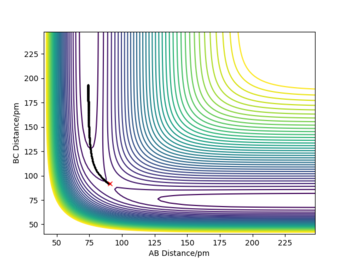
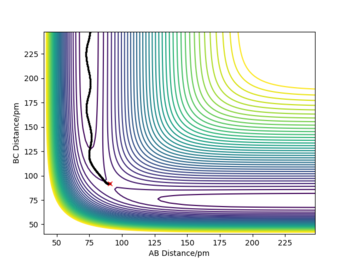


Reactive and unreactive trajectories
Complete the table above by adding the total energy, whether the trajectory is reactive or unreactive, and provide a plot of the trajectory and a small description for what happens along the trajectory. What can you conclude from the table?
For the initial positions r1 = 74 pm and r2 = 200 pm, the following trajectories with the following momenta combination were run:
(in the descriptions A B and C are used to describe the atoms colliding: AB is the initial H2 approaching H, represented by C)
| # | p1/ g.mol-1.pm.fs-1 | p2/ g.mol-1.pm.fs-1 | Etot | Reactive? | Description of the dynamics | Illustration of the trajectory |
|---|---|---|---|---|---|---|
| 1 | -2.56 | -5.1 | -414.3 | yes | The reaction dynamics proceed in a straight forward manner: AB and C approach each other, a collision occurs with the correct momentum for the reaction to proceed and a new vibrating. Pu12 (talk) 20:41, 21 May 2020 (BST)
bond BC is formed. |
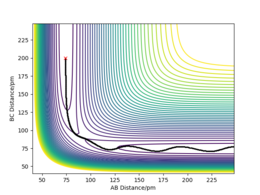
|
| 2 | -3.1 | -4.1 | -420 | no | AB approaches C and collides with it, but it doesn't have enough momentum to form a new bond so they are repelled. Momentum transfer does occur and C goes back with a greater momentum. | 
|
| 3 | -3.1 | -5.1 | -414 | yes | Oscillating AB collides with C and forms a new bond. The new H2 molecule, BC, has a higher vibrational frequency. A's direction is reversed. | 
|
| 4 | -5.1 | -10.1 | -375 | no | AB approaches C and a BC bond forms, however, the system has too much momentum and C is repelled by the nucleus in B and bounces back. This leaves AB with greater vibrational energy and the distance BC increases as C is repelled. | 
|
| 5 | -5.1 | -10.6 | -349 | yes | AB collides with C and a new bond forms. However, unlike above, C still has enough energy to overcome the activation barrier. So, the BC bond forms, it breaks and reforms AB which then collides again with C to reform BC and leave as 2 entities: A + BC | 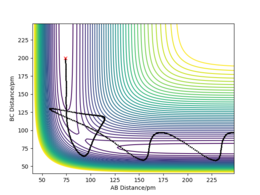
|
You didn't conclude what you learned from the table, this would just be a quick line about how having a high reactant momentum doesn't necessarily mean that you will get a reaction due to recrossing. Pu12 (talk) 20:41, 21 May 2020 (BST)
Transition State Theory
Given the results you have obtained, how will Transition State Theory predictions for reaction rate values compare with experimental values?
Transition State theory allows us to investigate the progress of a reaction by splitting it into 2 parts: reactants and products.
- For a reaction to occur the reactants must cross into the product "space" by going over the saddle point – the transition state!
- With the Born-Oppenheimer approximation[1], it is assumed there is a single saddle point (thus transition state) per reaction
- Transition State theory should only be used to estimate reaction rates at low temperature as it fails to correctly predict reaction rates for scenarios with high momentum (ie high temperature), where the transition state can be recrossed and thus predict reaction rates which are a poor match with experimental values
- We must also take into account that not every reaction with the correct energy will react, as for example, we must also take into account orientation, so, predicted rates with TS theory will be higher than experimental values.
EXERCISE 2: F - H - H system
PES inspection
Classifying F + H2 and H + HF reactions
By inspecting the potential energy surfaces, classify the F + H2 and H + HF reactions according to their energetics (endothermic or exothermic). How does this relate to the bond strength of the chemical species involved?
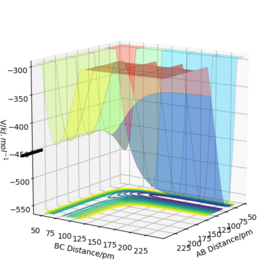
This can be deduced by inspecting the PES surfaces bellow. (A=F, B=H, C=H)
- F + H2 → HF + H : Exothermic
- Looking at the reactants: A + BC in the PES plot (small BC distance, large AB distance), we can see they have a higher potential energy than the products: AB + C. Which is confirmed by looking at bond strengths[2]: breaking the H–H bond (432 kJ/mol) vs making the H–F bond (565 kJ/mol), so energy is released during the reaction.
- HF + H → H2 + F : Endothermic
- If we know look at: AB + C as reactants (small AB distance, large BC distance) we can see they have a lower potential energy than the products: BC + A. It is again rationalised by the fact that the H-F bond being broken in the reaction is stronger than the H-H bond being formed, so it requires an amount of energy to initiate the reaction.
Good. Pu12 (talk) 20:41, 21 May 2020 (BST)
Transition state for F-H-H system
Locate the approximate position of the transition state.
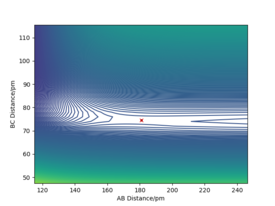
From Hammond's postulate we know that in an endothermic reaction the transition state resembles the products and in an exothermic reaction it resembles the reactants. So, we can infer that the transition state will resemble F + H2.
The transition State for the F-H-H reaction was found at: 181.11 pm AB and 74.487 pm BC, with 0 initial momenta for both. This was done by varying the distances until they remained constant, confirmed by the forces along AB and BC being 0, marking a stationary point as the first derivative is 0.
Activation Energy for F + H2 and H + HF reactions
Report the activation energy for both reactions
The MEP was found for both reactions for a structure neighbouring the transition state: rts+~1 pm.
The activation energy is the difference between the saddle point's maximum energy and the minimum energy of the products:
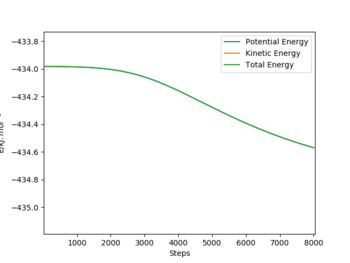
- Reaction 1: F + H2 → HF + H
- TS Energy: - 433.8 kJ / mol
- Final Energy: - 434.5 kJ / mol
- Activation Energy: + 0.7 kJ / mol
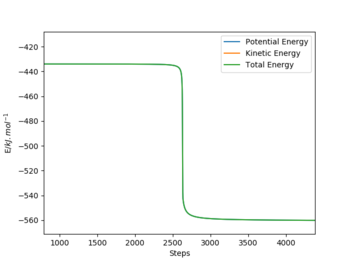
- Reaction 2: HF + H → H2 + F
- TS Energy: - 434 kJ / mol
- Final Energy: - 560 kJ / mol
- Activation Energy: + 126 kJ / mol
Correct. Pu12 (talk) 20:41, 21 May 2020 (BST)
Reaction Dynamics
Reactive trajectory for F + H2 → HF + H
In light of the fact that energy is conserved, discuss the mechanism of release of the reaction energy. Explain how this could be confirmed experimentally.
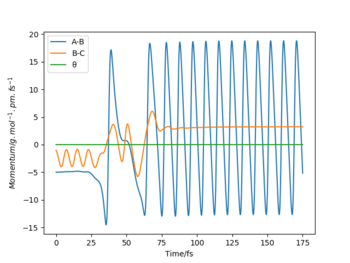
Using initial conditions; rAB = 225 pm, rBC = 75 pm, pAB = -5 g.mol-1.pm.fs-1, pBC = -1 g.mol-1.pm.fs-1, F + H2 → HF + H is a successful reaction, and, as seen above, this is an exothermic reaction and thus energy is released. From the animation we can see that a vibrating H2 molecule (BC) approaches F (A) and an HF bond forms, however it breaks and reforms BC, which then collides again with the Fluorine atom to reform a highly energetic HF and leave as the final products: HF + H.
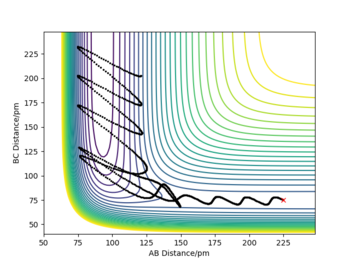
The energy in the reaction is converted from potential energy to kinetic energy, which is shown by the highly vibrating HF molecule, compared to the initial H2. This is confirmed with a Momentum vs Time plot (shown bellow): the AB distance, representing the HF bond, oscillates at a much larger amplitude than the initial BC oscillations which represent the H2 molecule.
Experimentally, this would result in an increase in temperature of our reaction mixture, which could be measured using calorimetry. Additionally, the HF vibrational modes would be highly excited and overtones would show in the IR spectra as multiples of the fundamental absorption frequency[3] (3962 cm-1)[4]. Because overtone bands are difficult to see, this could be done using use Low Temperature FTIR[5].
Illustrating Polanyi's empirical rules [ Reaction 2: HF + H → H2 + F ]
Discuss how the distribution of energy between different modes (translation and vibration) affect the efficiency of the reaction, and how this is influenced by the position of the transition state
Polyani's Rules[6]state that:
- For an early transition state, translational energy is more efficient in promoting a reaction
- For a late transition state, vibrational energy is more important in promoting a reaction
So, for the endothermic reaction HF + H → H2 + F, compared to the reverse exothermic reaction, we need a higher amount of vibrational energy, as well as translational to overcome the transition state and for a reaction to occur.
This can be illustrated by comparing the following initial reaction conditions (A=F, B=H, C=H, rAB = 75 pm, rBC = 225 pm):
- pAB = -1, pBC = -5 – Unsuccessful Reaction 2 (NB. under these conditions Reaction 1 is successful, as shown above)
- pAB = -2, pBC = -4 – Successful Reaction 2 when we redistribute momentum to increase vibrational energy
(units of p: g.mol-1.pm.fs-1)
You could also give evidence for the reverse case, but all correct. Pu12 (talk) 20:41, 21 May 2020 (BST)
This is a good report, you answer the questions correctly and concisely, well done. Pu12 (talk) 20:41, 21 May 2020 (BST)


