
MRD:cej15
Molecular Reaction Dynamics
Exercise 1: H+H2 system
Dynamics from the transition state region
Figure 1 shows the plot of the Potential Energy Surface at initial conditions i.e. the bond distance between AB is 0.74 Angstroms and that between BC is 2.30 Angstroms.

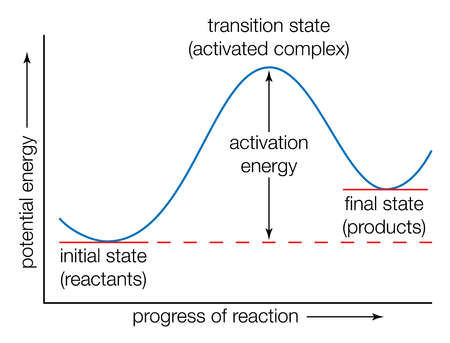
The black wiggly line shows the reaction trajectory of the collision. The beginning and the end of the line show patterns that are related to the vibrations of the reactant and the product respectively. The part in between where the line starts turning in a different direction shows the transition state. A transition state is defined as the state in a reaction where the potential energy is the highest as shown in Figure 2. At a minimum and at a transition state, the total gradient equals zero due to δV/δr=0. However, in order to distinguish between the maximum and the minimum, the second derivative would be needed. For the transition state, the second derivative would be a negative value and would be positive for the minima.
Trajectories from r1 = r2: locating the transition state
In order to locate the transition state position, rts, an estimate was first obtained by producing a plot of internuclear distance vs time, using initial conditions. As shown in Figure 3, the lines that represent the internuclear distances of AB and BC intersect at one point where they have a same internuclear distance, and that shows the estimated transition state, at around 0.9 Angstroms. Values were altered until the smallest black dot was produced in a plot of the potential energy surface, as shown in Figure 4. The transition state position was estimated to be 0.908 Angstroms.
Calculating the reaction path
For determining the minimum energy path, the distance between AB = rts = 0.908 Angstroms and BC = rts+0.01 = 0.918 Angstroms. The mep calculated is shown in Figure 5. The short black line going upwards shows that the reaction tended to go to the reactants.

Trajectories from r1 = rts+δ, r2 = rts
The same conditions were used for obtaining the mep plot, but the calculation type was changed to dynamics. By comparing Figure 6 with Figure 5, a longer, more wiggly line was obtained for the dynamic plot. This means that for the dynamic type of calculation, it follows the reaction more than for the mep type.

Reactive and unreactive trajectories
The initial positions set were: r1 = 0.74 Angstroms and r2 = 2.0 Angstroms. The momenta were altered and the trajectories are reported below in Table 1.
| p1 | p2 | Reactivity | Figure | Description |
|---|---|---|---|---|
| -1.25 | -2.5 | Reactive |  |
The reaction proceeded from reactants to products. |
| -1.5 | -2.0 | Unreactive |  |
The activation barrier was too high for the reaction to proceed. |
| -1.5 | -2.5l | Reactive |  |
The reaction proceeded from reactants to products. |
| -2.5 | -5.0 | Reactive |  |
The reaction reached the transition state, but energy was too high to form products. |
| -2.5 | -5.2 | Reactive |  |
The reaction proceeded from reactants to products. |
The main assumptions for the transition state theory include: the transition state species are in equilibrium with the reactants; any system can only pass through the transition state once (before any other collision or before it is stabilized as a reactant or a product). [1]
- ↑ Truhlar, D. G., Garrett, B. C., & Klippenstein, S. J. (1996). Current Status of Transition-State Theory. J. Phys. Chem., 100(31), 12771–12800. https://doi.org/10.1021/jp953748q.
Exercise 2: F - H - H system
PES inspection
The initial conditions were set as the same as that in section 1.1.1. For the reaction F + H2, atom A and B were still hydrogen but atom C was changed to fluorine. The reaction proceeds successfully as shown in Figure 7. For the reaction H + HF, atom B and C were hydrogen and atom A was changed to fluorine. As shown in Figure 8, the trajectory crosses the transition state region, which means that the reaction had enough energy to form the product, but is reverted back to the reactants. This shows that the first reaction is exothermic as the activation energy is lower than that of the second reaction. The second reaction is therefore endothermic. This result indicates that the product formed from the 1st reaction, HF, has a stronger bond strength than that formed in the 2nd reaction, H2.


In order to find the transition state, the Hammond Postulate is used.[1]
- ↑ Cioslowski, J. (1991). Quantifying the Hammond postulate: intramolecular proton transfer in substituted hydrogen catecholate anions. J. Am. Chem. Soc., 113, 6756. https://doi.org/10.1021/ja00018a006.
As the reaction is an exothermic one, and the Hammond Postulate states that the more exothermic a reaction is the earlier the transition state is, the HF bond distance in the transition state would be larger than the HH bond. Therefore, in order to find rts, the bond distance of HF was decreased until a single dot was seen on the mep plot of the potential surface energy as shown in Figure 9, which is around 1.816 Angstroms.
Figure 10 shows the energy difference between the transition state of the exothermic reaction and the product formed. The difference between the energies would then be the activation energy of the reverse process - the endothermic reaction. Therefore the activation energy calculated for the endothermic reaction is [-103.8 - (-133.8)] = 30.0 kcal/mol, which is 125.52 kJ/mol.

In order to calculate the activation energy for the exothermic reaction, instead of measuring the energy difference between the transition state and the products, that of the transition state and the reactants were determined by finding the lowest energy point (position of cursor in FIgure 11) before the transition state. It was measured to be -103.9 kcal/mol and the energy for the transition state is -103.3 kcal/mol, giving an activation energy of [-103.3 - (-103.9)] = 0.6 kcal/mol i.e. 2.51 kJ/mol.

Reaction dynamics
The observations of the trajectories obtained when changing the value of pHH while keeping pFH, rFH and rHH constant are shown in Table 2.
| pHH | Reactivity | Figure |
|---|---|---|
| -3.0 | Unreactive | 
|
| -2.0 | Unreactive | 
|
| -1.0 | Unreactive | 
|
| 0.0 | Unreactive | 
|
| 1.0 | Unreactive | 
|
| 2.0 | Unreactive | 
|
| 3.0 | Unreactive | 
|
By comparing the trajectories, it can be seen that as the absolute value of the momentum increases, the black lines become wider. This shows that as the energy increases due to increase in momentum, the vibration of the molecules increase. However, all the reactions are not successful.